Insights
17 July 2025

Research: UK homes gain £55,800 as values rise 20% in 5 years

Zoopla research reveals UK homes have gained £55,800 on average since the pandemic. Discover where the biggest gains are and how the widespread rise in home equity could be a game-changer for your pipeline.

Ellie IsaacContent Manager

Key takeaways

  • New research shows that UK homeowners made an average gain of 20% or £55,800 since the end of the Covid-19 pandemic

  • 80% of the UK’s housing stock has gained at least 5% in value since June 2020

  • The North West has seen the most homes gain at least 50% in value (12%), followed by Wales, Scotland and Yorkshire & the Humber

  • Homes in the south of England have seen modest increases, with half gaining up to 20% in value

  • There’s no single UK housing market: on-the-ground insight from local agents is key in setting an asking price that achieves a sale

  • Informed homeowners become motivated movers, and we’re unlocking this audience for our partners with our new product Prospect Plus

Our latest research reveals the truth behind UK home values since the pandemic, proving that property continues to be a powerful asset for homeowners.

UK homes have gained an average of 20% in value in the last 5 years. With the average gain worth £55,800, would-be sellers could be sitting on more equity than they think - potentially unlocking their next move.

It’s not just a handful of properties, either. 23 million UK homes have gained at least 5% in value since June 2020. That’s 80% of the country’s housing stock.

And 1 million homeowners have gained more than 50% in value, mostly in affordable high-growth markets in the North West, Wales and Yorkshire & the Humber. Even in the south of England, where price growth has been slower, more than half of homes have gained up to 20% in value.

In a housing market constantly under the microscope, one thing remains clear: homeowners are still building wealth.

There is no single UK housing market, and our latest research shows just how much home value trends vary across the country. It’s critically important that serious sellers fully understand local market dynamics and the influence on the value of their home. While our research and tools like MyHome give homeowners an estimate, estate agents provide the next level of on-the-ground insight. Your unique local knowledge is key to setting an asking price that achieves a sale.

Richard Donnell

Executive Director – Research

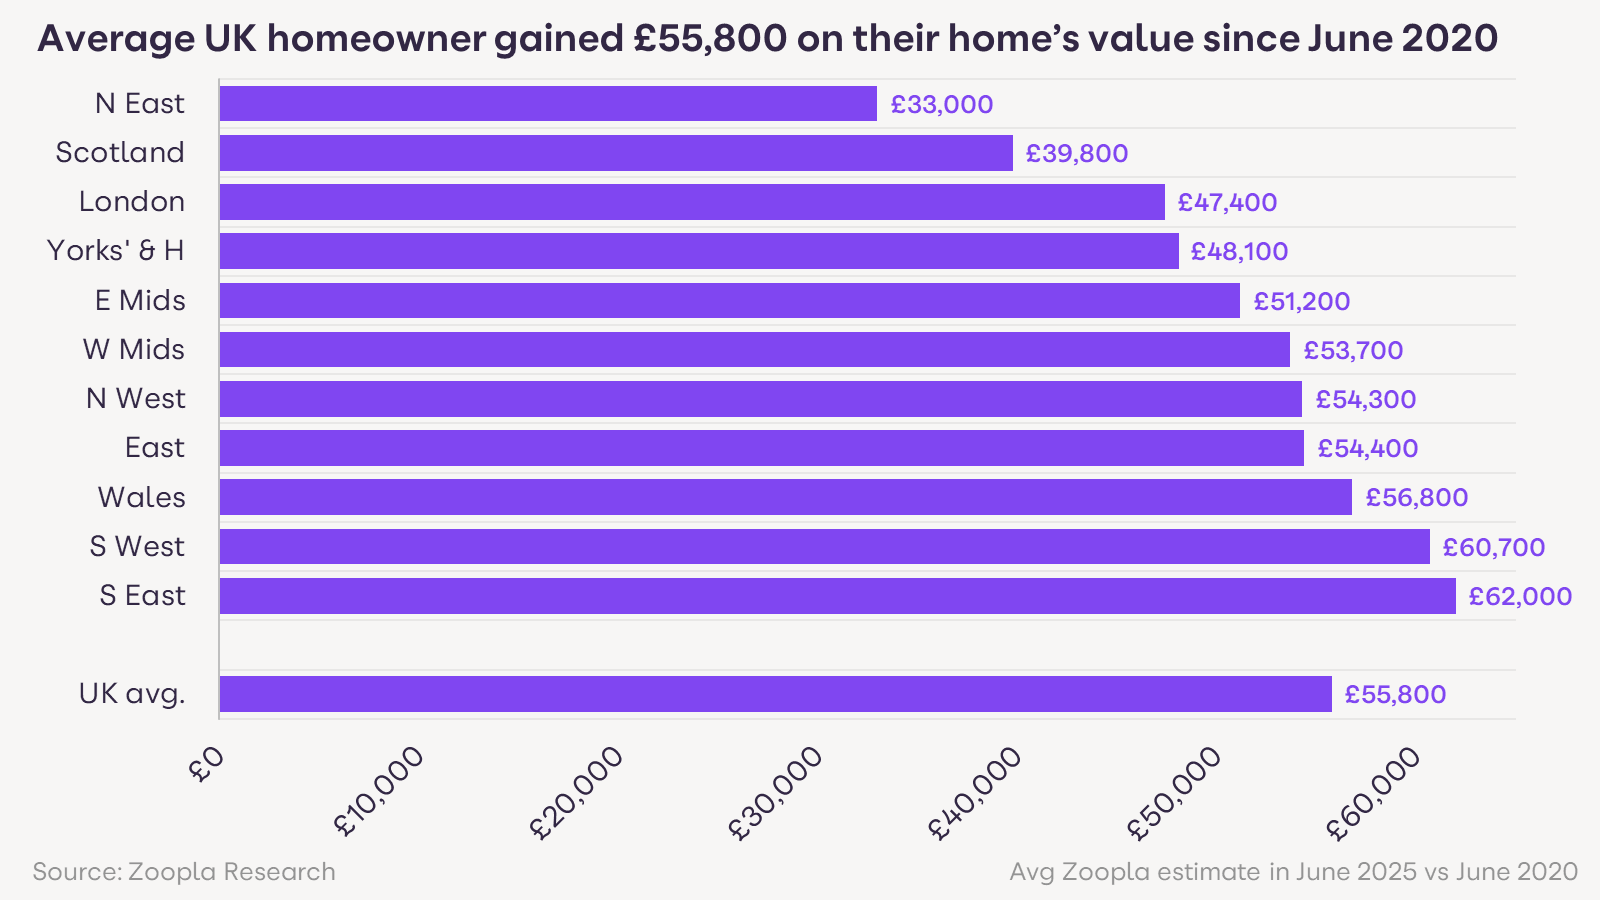
Regional breakdown: Home value growth in your region

Understanding where these gains are concentrated can help identify new instructions and set realistic asking prices. Let’s dive into the high-growth affordable markets in the north and Wales, and the slower growth - but big cash boosts - in the south.

The North West, Yorkshire and the Humber, and Wales have seen the strongest value growth since June 2020. They have the highest proportion of homes with 50%+ value gains in 5 years, and also make up the most UK homes with this level of gains.

The North West topping the table is in line with other trends we're seeing right now, with the region recording the highest sale numbers and the strongest rise in sale prices. High mortgage rates and rising rents have encouraged home buyers to seek out value for money in localised markets, and the North West is proving particularly resilient to market challenges.

Region

% of homes increasing in value by over 50%

Average value of these homes in June 2020

Average value of these homes in 2025

Average value change of these homes 2020-25

North West

12%

£122,200

£199,300

£77,100

Wales

11%

£140,100

£230,800

£90,700

Scotland

6%

£129,900

£222,900

£93,000

Yorkshire and The Humber

6%

£129,300

£215,500

£86,200

North East

5%

£99,500

£168,700

£69,200

UK

5%

£167,900

£285,300

£117,400

East Midlands

4%

£163,000

£277,300

£114,300

West Midlands

4%

£166,900

£278,200

£111,300

South West

3%

£287,200

£503,500

£216,300

South East

2%

£387,700

£687,300

£299,600

East of England

2%

£292,700

£518,800

£226,100

London

1%

£454,100

£825,100

£371,000

It’s a different story in the south, with weaker value growth and some modest price falls in inner London. However, low value rises can still translate to big cash boosts here due to higher house prices.

51% of southern homes have gained up to 20% in value in the last 5 years, with this group gaining £62,000 on average.

A bar chart showing the 5-year value gains for UK houses in different regions

The rise in mortgage rates has gone further in impacting demand in the south, limiting first-time buyer affordability and discouraging landlord investment.

Value losses have mainly been seen in London, where 13% of homes have lost 5% or more - an average of £34,000. Almost half of all homes in Westminster and Kensington & Chelsea are now worth less than in June 2020.

Growing our unique audience of 4.5m+ movers in MyHome

This research is all about encouraging homeowners to dive into market trends and uncover personalised insights using our MyHome tool.

4.5m+ homeowners are already using the free tool to track the value of their home, see what other properties are selling for and understand demand for homes like theirs.

We know that informed homeowners become motivated movers. And we’re unlocking this audience for our estate agent partners for the first time with our new premium vendor product, Prospect Plus.

Prospect Plus allows you to tap into our MyHome audience, targeting homeowners who are ready to sell in areas and price bands that suit your strategy. With 43% converting from lead to instruction, these are some of the highest-converting vendor prospects in the market.

Prospect Plus

Get first access to serious sellers and connect with top-quality prospects to grow your market share.

An aerial view of semi-detached houses with the stat '43% of prospects convert to instruction'

More quality

The UK’s most serious sellers use MyHome - secure these high-converting prospects before your competition does.

More instructions

Win in the living room: see your prospect’s price expectations, their property searches and which agents you’re up against.

More sales

43% of these prospects convert to instruction, fuelling faster sales and boosting your commission revenue.

Local authorities: Top home value gains

We’ve looked at the UK local authority areas with the highest percentage of homes that have gained 50%+ in value since June 2020.

Oldham in the North West leads the pack, with 35% of its homes gaining over 50% in value, averaging a £62,900 increase. Blaenau Gwent and Merthyr Tydfil in Wales follow closely with 32% of homes seeing similar gains. 

Other strong performers include Barnsley (Yorkshire and Humber), Argyll and Bute (Scotland), and Sandwell (West Midlands), all showing double-digit percentages of homes with substantial value growth.

More affordable, high-growth markets, particularly in the North and Wales, have been key drivers of significant equity gains for homeowners over the past 5 years. 

Even in more expensive regions, specific desirable areas like the Cotswolds and Isle of Wight have seen high numbers of homes with bigger gains, also with much larger average value changes in pound terms.

Local authority

Region

% homes with value increases of 50%

Jun 25 value - homes with +50%< gains

Avg. value change (£)

Oldham

North West

35%

£164,000

£62,900

Blaenau Gwent

Wales

32%

£132,300

£49,900

Barnsley

Yorkshire and Humber

13%

£151,400

£56,400

Argyll and Bute

Scotland

12%

£249,700

£110,800

Sandwell

West Midlands

11%

£211,600

£78,400

Bolsover

East Midlands

9%

£146,200

£55,500

Middlesbrough

North East

9%

£93,200

£35,200

Cotswolds

South West

6%

£777,500

£361,600

North Norfolk

East of England

5%

£418,300

£216,700

Isle of Wight

South East

4%

£451,400

£182,400

Waltham Forest

London

2%

£672,000

£365,000

About this research

This research looks at the change in our 30m+ MyHome property estimates between June 2020 and June 2025. 

Our complex valuation model is industry-leading due to its extensive data and 20+ years of use. We use algorithms and data sources from public records, such as property sales and HM Land Registry, to produce unique estimates for 30 million properties across the UK.

We also published this research on Zoopla.co.uk.

We try to make sure that the information here is accurate at the time of publishing. But the property market moves fast and some information may now be out of date. Zoopla accepts no responsibility or liability for any decisions you make based on the information provided.

Related articles

House Price Index: May 2025

28 May 2025

Our House Price Index tracks the key trends in the UK housing market, showing agreed sales in May have reached the highest level in 4 years. With lots of homes for sale and price rises modest, buyers can benefit from relaxed affordability testing while sellers need to be supported with pricing advice.

Read more

Zoopla x Halifax: Property market outlook

11 Jun 2025

The market is shifting, and opportunities are changing. Whether you're working with sellers, buyers or landlords, having the right insight at your fingertips is key to making confident decisions—and helping your clients do the same.

Read more