
House Price Index: May 2025
Our House Price Index tracks the key trends in the UK housing market, showing agreed sales in May have reached the highest level in 4 years. With lots of homes for sale and price rises modest, buyers can benefit from relaxed affordability testing while sellers need to be supported with pricing advice.
Key takeaways
The number of sales agreed in the UK is at the highest level for 4 years in May 2025
Supply (+13%) and sales (+6%) are both up on last year as the market rebounds after initial reaction to the end of stamp duty relief
UK house price inflation remains stable at 1.6%
Re-engage with buyers to help them understand the potential boost to their affordability from relaxations to mortgage testing in recent weeks
Sellers in the North of England and Scotland are recording the highest growth in sale volumes
In the South of England, stock levels are high and sale volumes lower so strategy and pricing are key
The average UK seller is achieving 97% of asking price: a good figure to share to keep expectations realistic
The market is on track for 5% more sales and 2% price inflation over 2025
Executive summary
Helping buyers understand the boost from relaxed affordability testing
Affordability testing for mortgages has been relaxed in recent weeks, meaning buyers could now afford to borrow 20% more than a few weeks ago - at the same mortgage rate.
It’s worth re-engaging with applicants from the early part of the year to see if the boost to affordability could enable or encourage a move.
Mortgage rates aren’t going to tumble, but we always recommend buyers speak to a mortgage broker to understand what they can afford. For those in the early stages of a move, our mortgage affordability calculator might be helpful.
The stock of homes for sale continues to build, giving plenty of choice: there are now 35 sellers per estate agent. Helping these sellers find a home to buy could be pivotal in building a chain and securing the sale and commission.
Supporting sellers considering an offer
There are a lot more sellers in the market but this varies across the UK with a clear divide between north and south.
The market in Northern England and Scotland is rolling along healthily, with 5% more homes for sale and the highest growth in sales volumes. With your guidance on price and strategy, those selling should attract plenty of interest and achieve a favourable result.
In the South of England, stock of homes for sales is up 15-20% and the growth in sales is smaller. It’s trickier to achieve asking price and sellers may need to consider offers given the lower level of competition.
The average UK seller is achieving 97% of the asking price - a good figure to share to keep expectations realistic.
Answering that age-old question: is now the right time to sell?
My view is that it’s not about it being a ‘good’ or ‘bad’ time to sell, but rather your clients’ motivations for moving.
There are buyers in the market and sales are being agreed for well-priced homes. If it’s the right time for your client to move, a strategy tailored to your local market should mean a successful sale.
Mortgage rates may drift lower, but those relaxed lending rules I’ve mentioned are already in place. Buyers using mortgages can now borrow more than earlier in the year, supporting demand as we move into the second half of 2025.
Ready to get ahead?
Every 1.5 seconds a mover connects with an estate agent or housebuilder on Zoopla. See how your business can win with us.

House Price Index May 2025
The average house price in the UK is £268,250 as of April 2025 (published May 2025). This is a rise of 1.6% or £4,330 over the past year.
Property type | Feb 2025 average house price | Mar 2025 average house price | Apr 2025 average house price | Annual house price change (£) to Apr 2025 | Annual house price change (%) to Apr 2025 |
All property | £267,600 | £268,200 | £268,200 | £4,330 | 1.6% |
Detached | £449,500 | £449,200 | £450,600 | £5,790 | 1.3% |
Flats/maisonettes | £191,800 | £191,900 | £192,100 | £290 | 0.2% |
Semi-detached | £275,200 | £275,100 | £276,000 | £7,120 | 2.6% |
Terraced | £237,400 | £237,100 | £237,900 | £5,460 | 2.4% |
Rebound in sales after initial reaction to end of stamp duty relief
The number of housing sales is on the rise with home buyers returning to the market after the end of stamp duty relief and the Easter holidays.
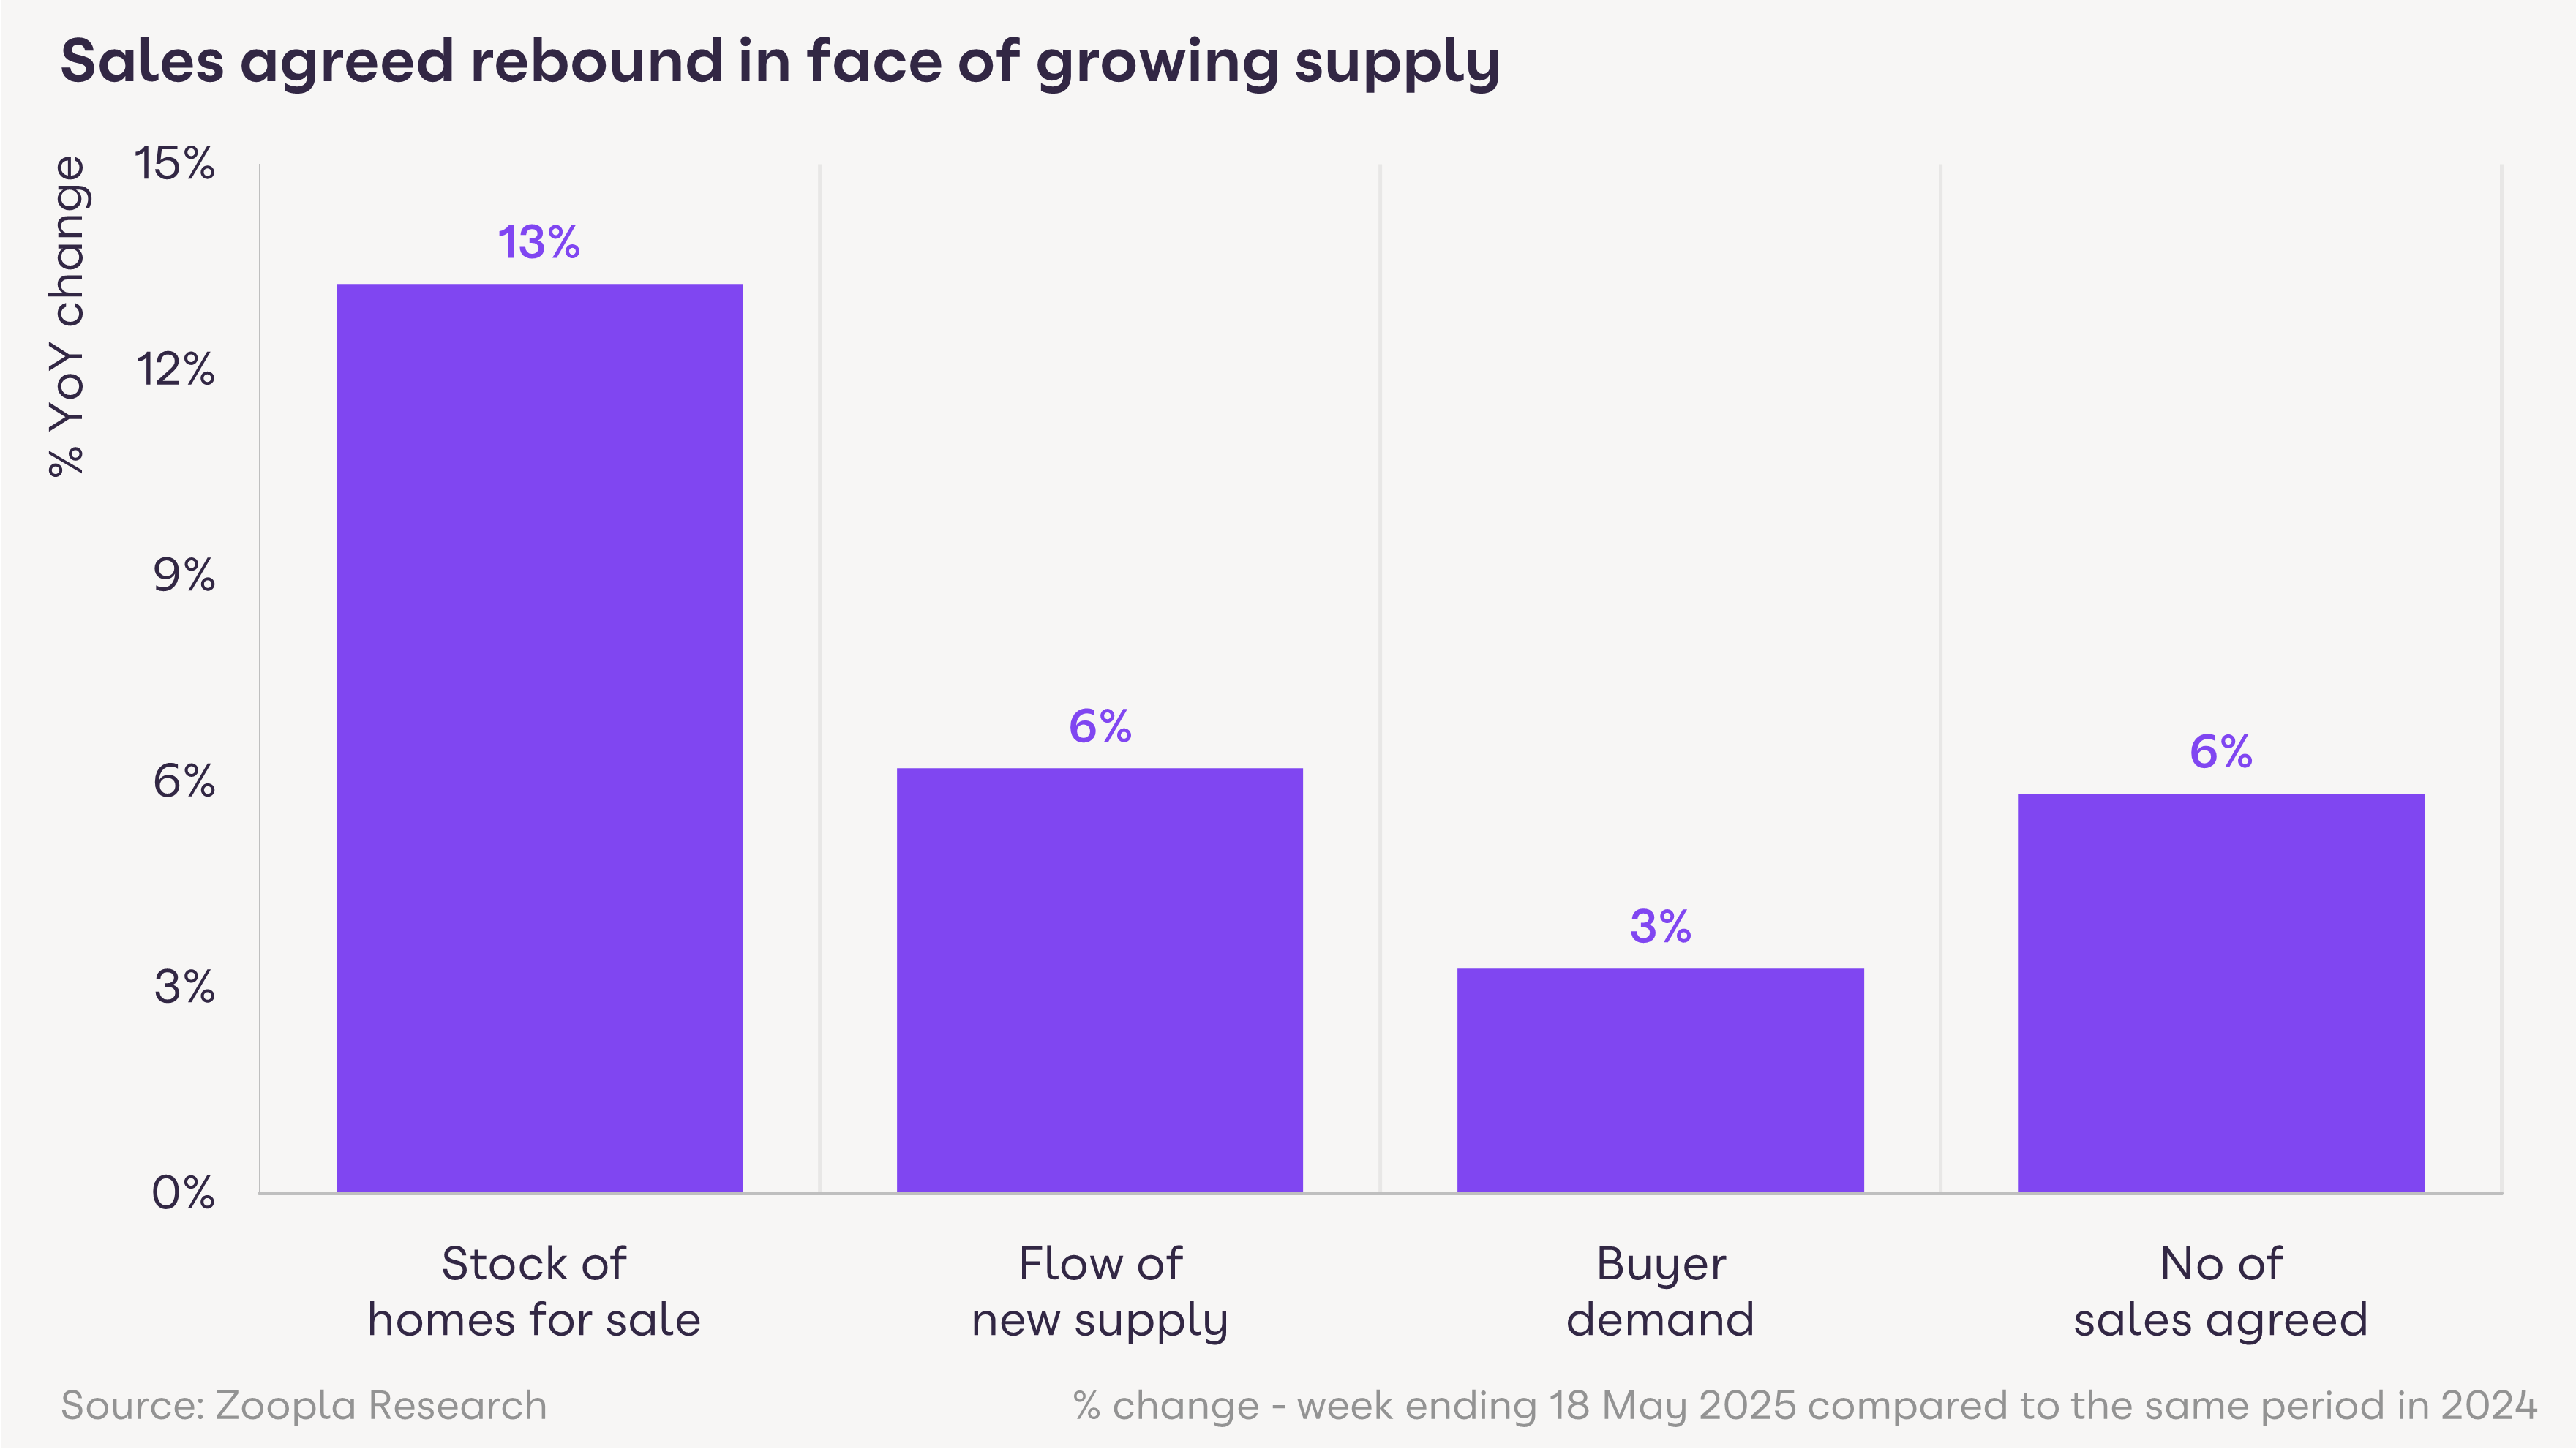
Our latest data shows the number of sales agreed per estate agent at this time of year is running at the fastest rate for 4 years, since the pandemic boom of 2021. This is due to a high number of homes for sale and improvements in mortgage rates and availability.
There are 13% more homes for sale than a year ago. The average estate agent office has 35 unsold homes. Most of these home sellers are also buyers, which means plenty of interest for well-priced homes. More mortgage products with sub-4% rates, together with changes to how mortgage affordability is calculated, are encouraging buyers to make offers, supporting a 6% growth in sales agreed.
The average UK house price is 1.6% higher than a year ago at £268,250, which is an increase of £4,330 over the year.
Our data shows the average home sale is currently being agreed at 3% (or £16,000) below the average asking price, a level that has been stable over recent months.
6% more agreed sales in May 2025 than a year ago
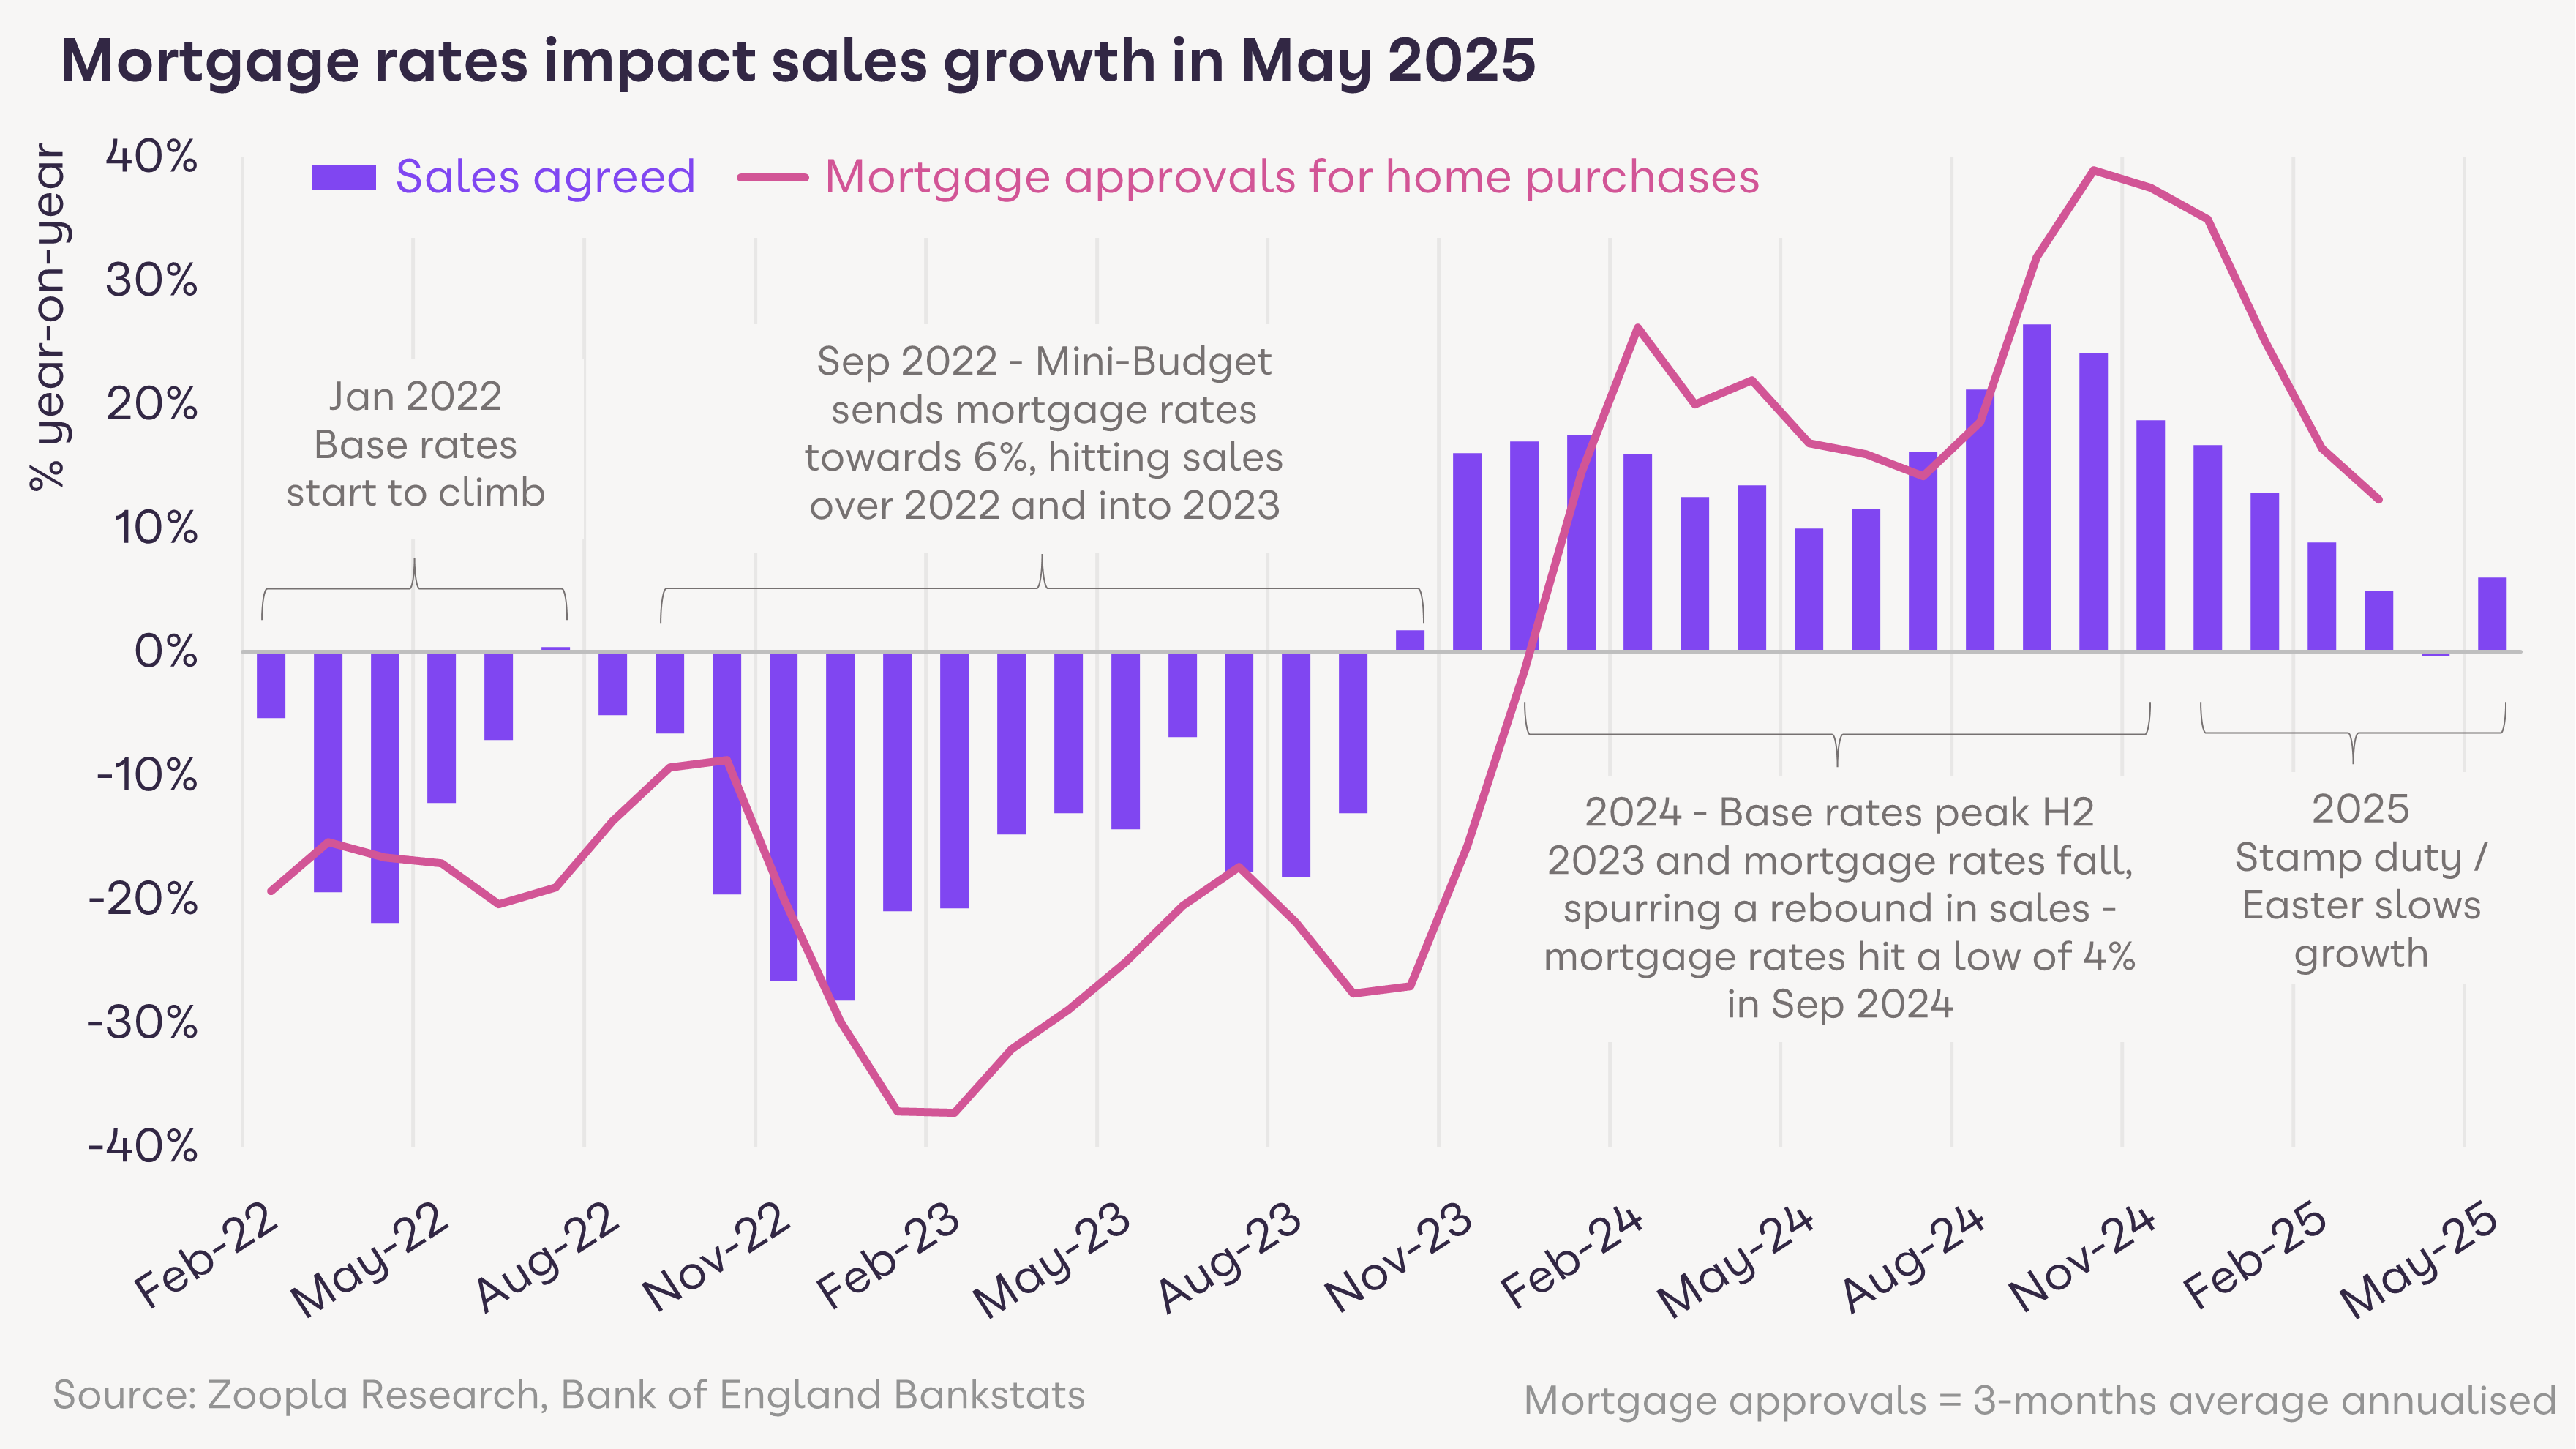
The shift to higher mortgage rates over the last 3 years has impacted growth rates for housing sales and mortgage applications. Sales declined sharply in 2022/23 as mortgage rates reached 6%.
The growth in sales rebounded over 2024 as mortgage rates fell, which also boosted demand for mortgages. However, the growth in sales and mortgage approvals has slowed in recent months to more sustainable levels.
Sales have now started to increase once again as confidence improves and those using a mortgage are able to borrow up to 20% more due to changes in affordability testing.
Tap into our well-known brand, unique audiences and pipeline of motivated movers.

Most affordable areas record fastest sales growth
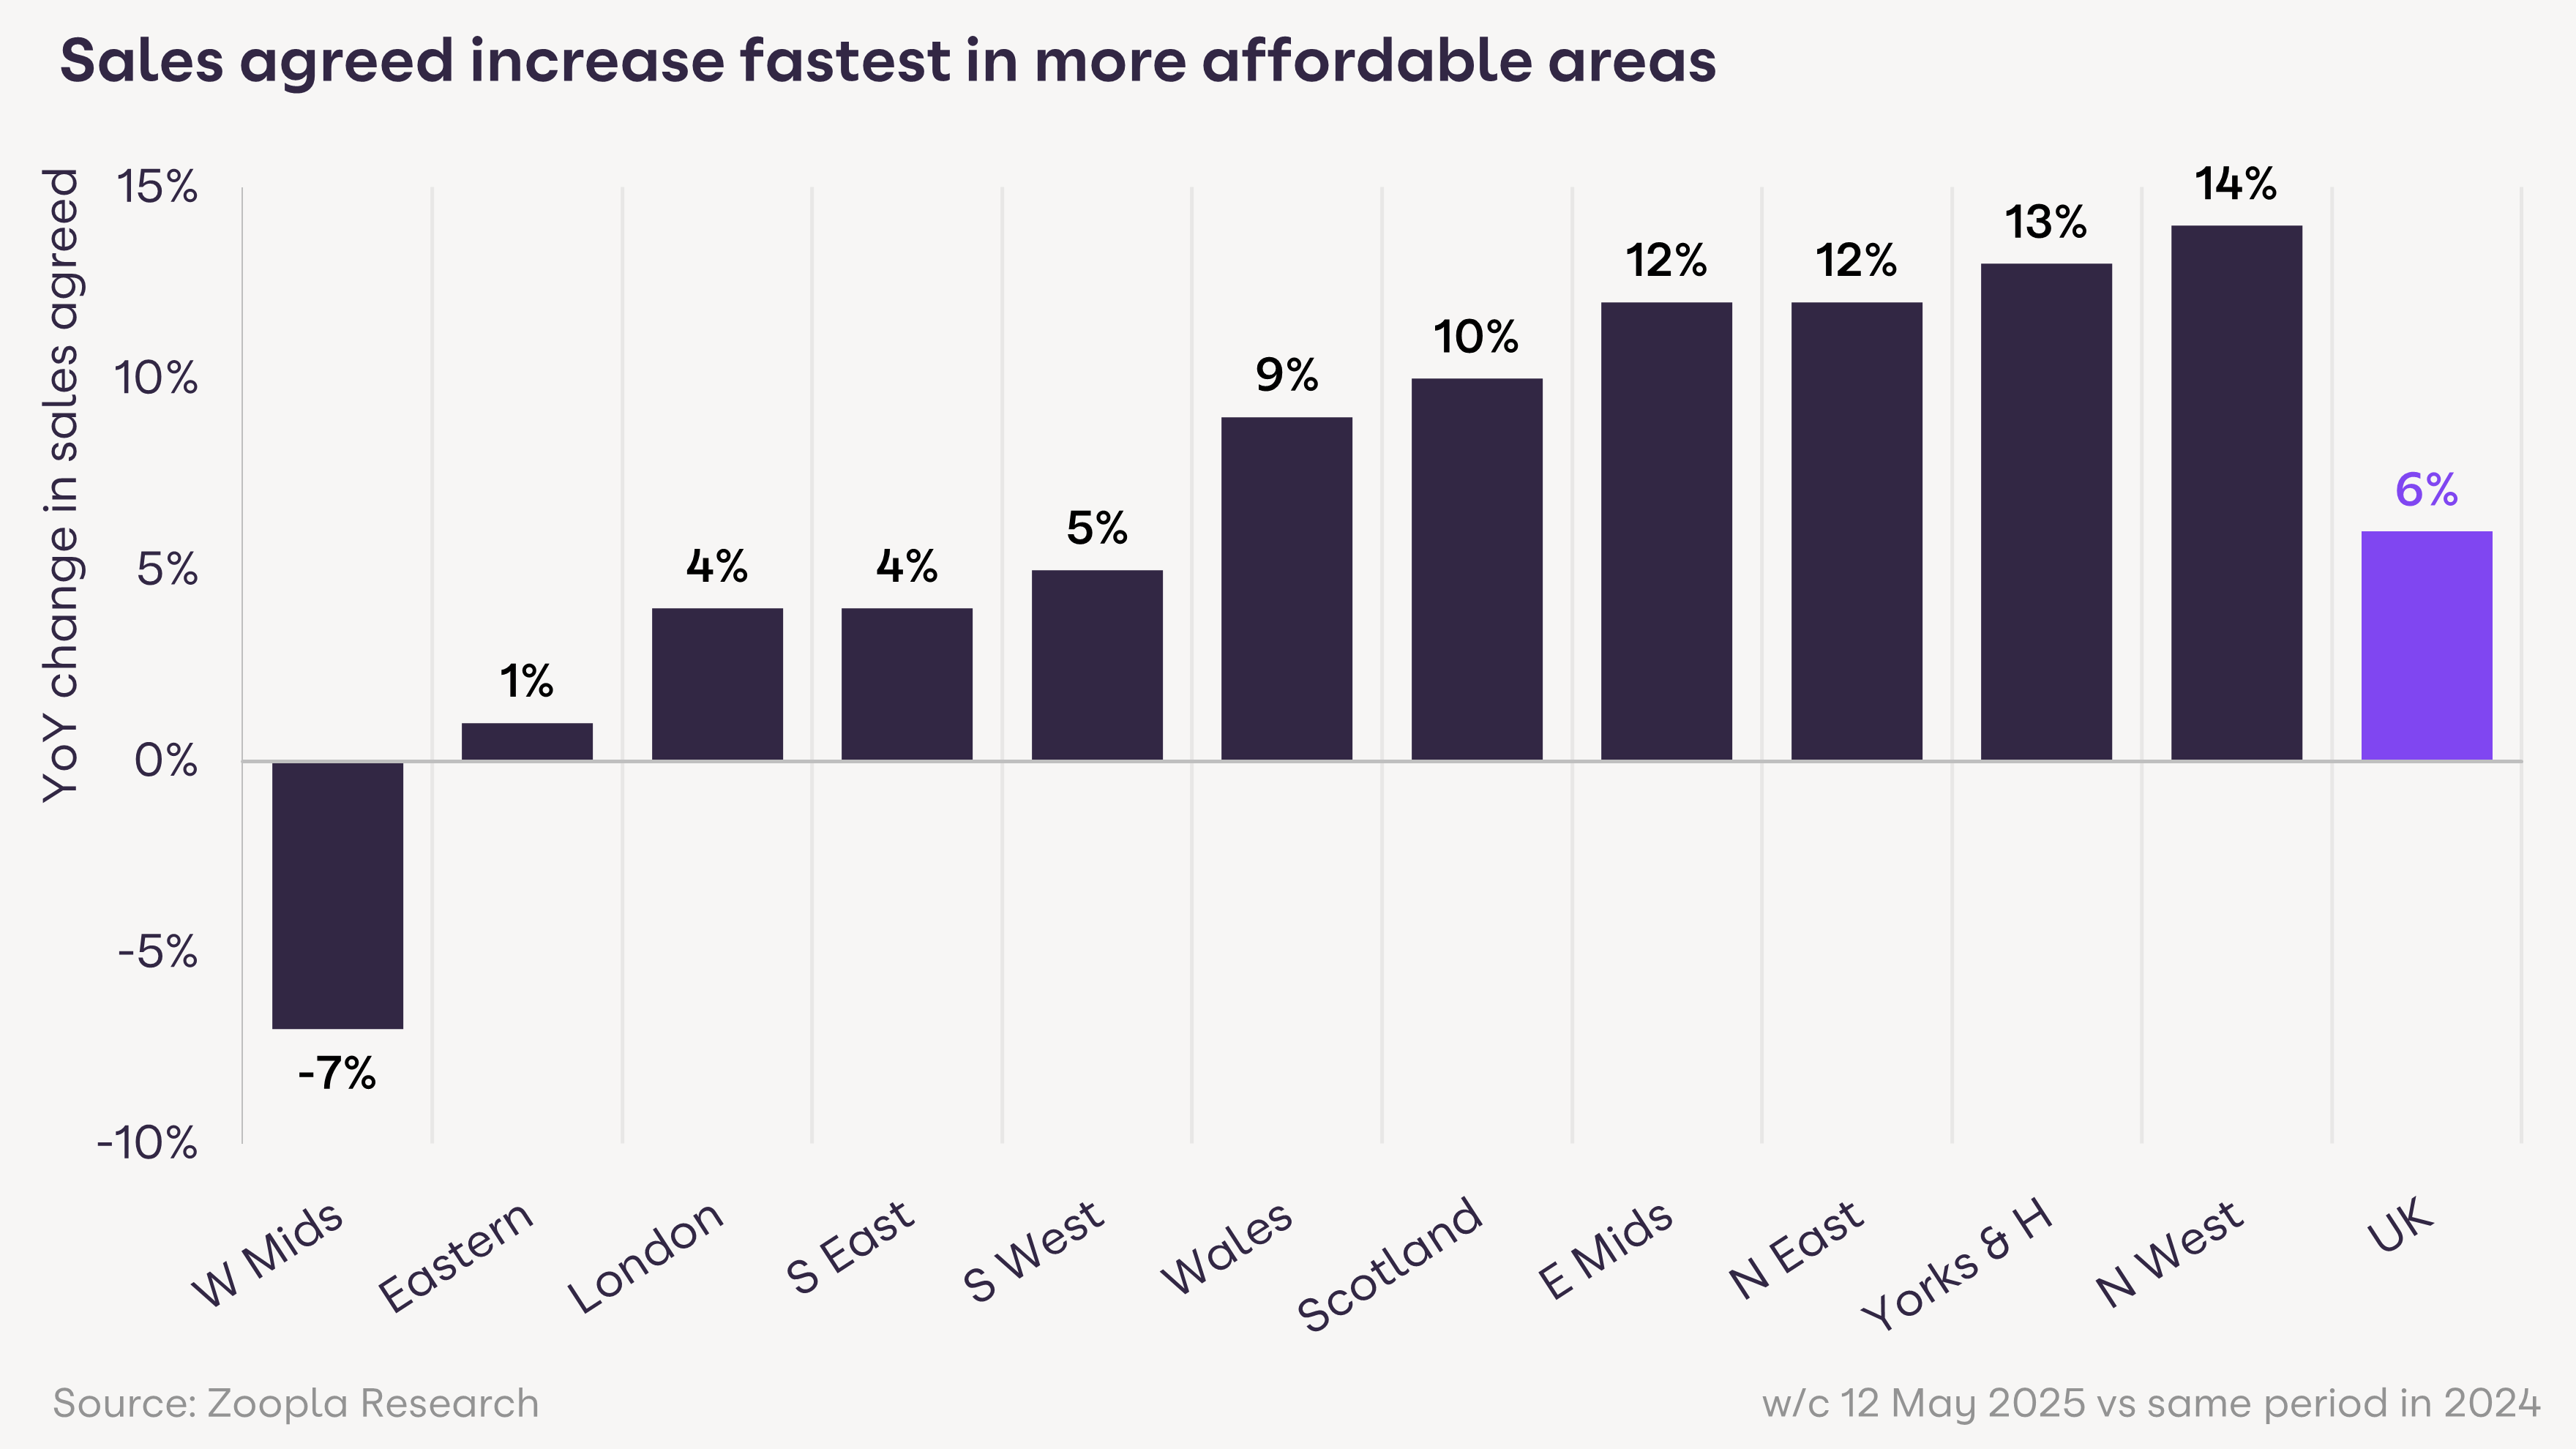
Housing market activity and house price inflation are currently strongest in areas where homes are more affordable. In broad terms, this covers most areas outside the southern regions of England.
Our data shows northern regions of England, Scotland and the East Midlands are registering the fastest growth in agreed sales compared to a year ago. However, affordability constraints are behind a slower growth in sales across southern regions of England, with a decline in sales in the West Midlands compared to a year ago.
The number of homes for sale is an important influence on market activity and house prices. More homes for sale boosts buyer choice and keeps price growth in check. Faster growth in sales erodes the number of homes for sale, limiting what is available and supporting faster house price growth.
More homes for sale across southern England
The number of homes for sale has grown most quickly across southern regions of England, boosting choice. There are 21% more homes for sale in the South West compared to a year ago, with 17% more in London and 15% more in the South East.
Slower growth in sales and more homes for sale explains why house price growth is less than 1% across all regions of southern England - ranging from 0.5% in the South East to 0.9% in the South West.
Fewer homes for sale in the North supports price inflation
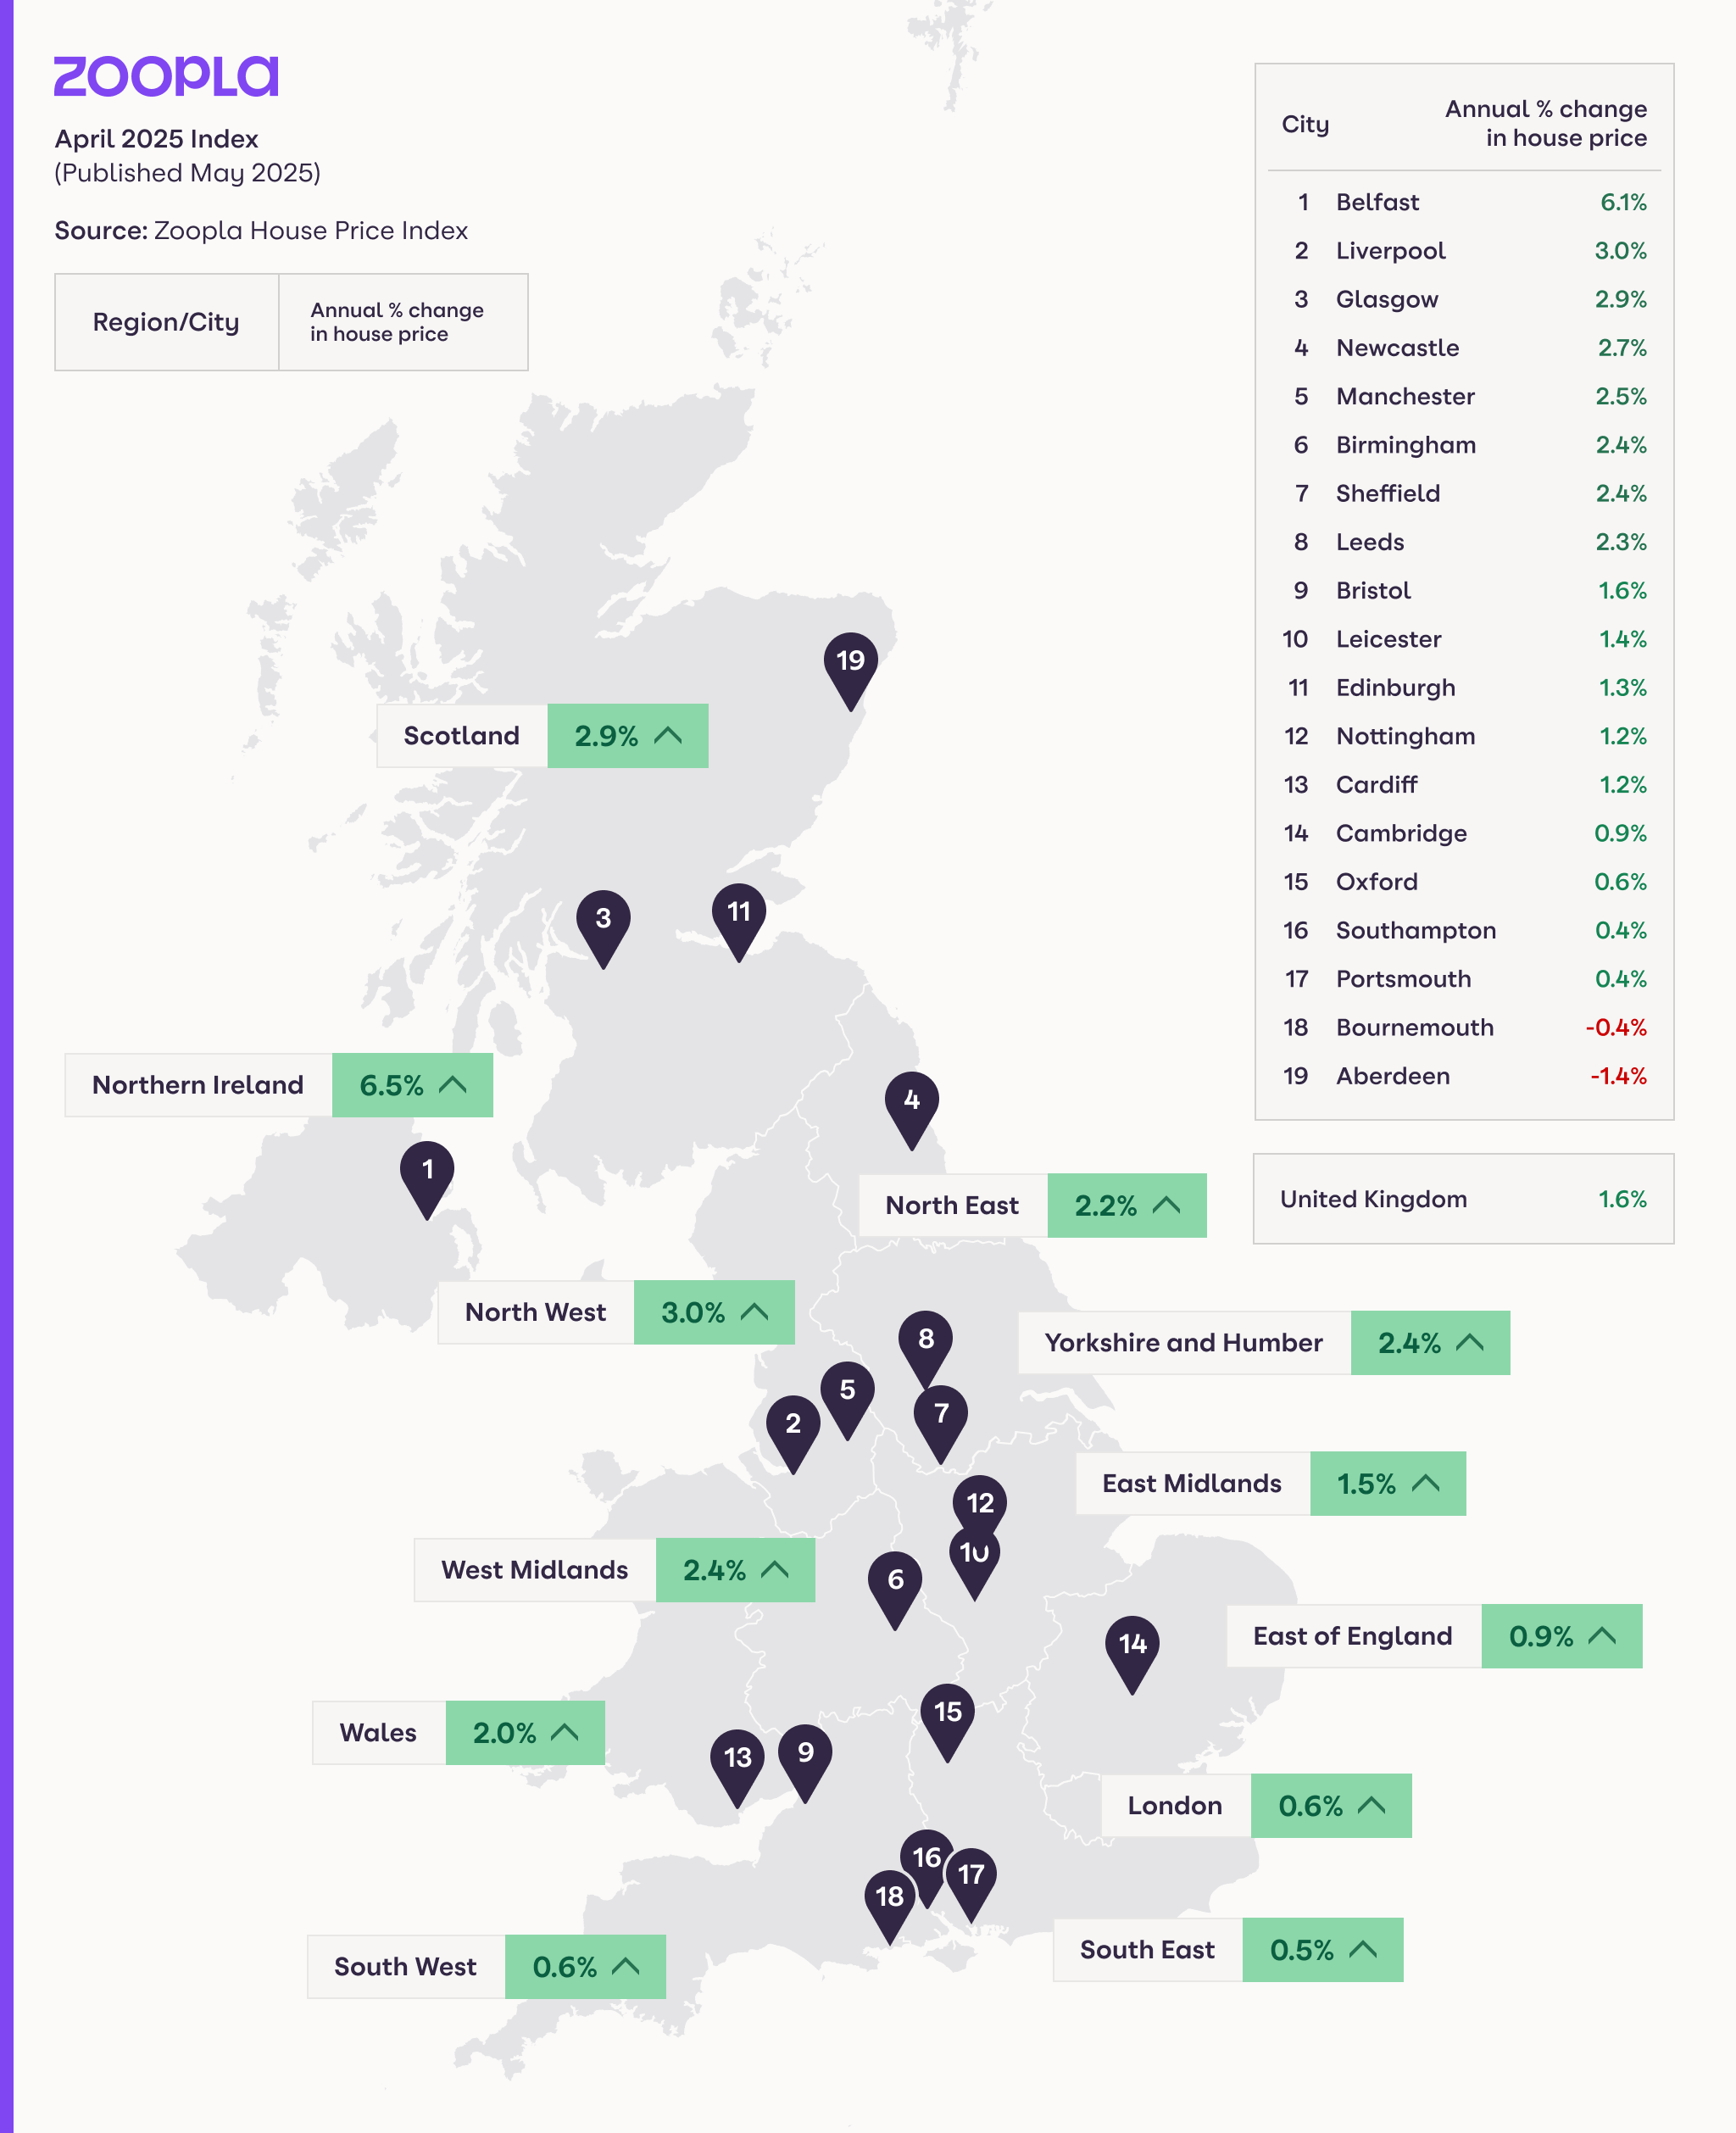
In contrast, there are just 3% more homes for sale in the North West and 5% more in Scotland than a year ago. Lower availability of homes for sale, better affordability and faster growth in sales explain why house prices are 3% higher across the North West and 2.9% higher in Scotland, with above-average price rises across northern England and Northern Ireland.
House prices rising by up to 6% in some UK cities
Looking below the regional level, house price inflation varies widely at a city level - from small price falls in Aberdeen, Brighton and Bournemouth to prices increasing by over 5% in Blackburn and Belfast. The fastest-growing markets tend to be outside southern England.
Cities across the North West are registering the highest rates of price growth, as rising employment growth boosts demand and prices. Higher home values and rents in large cities like Manchester are pushing demand into adjacent and accessible areas, boosting house prices.
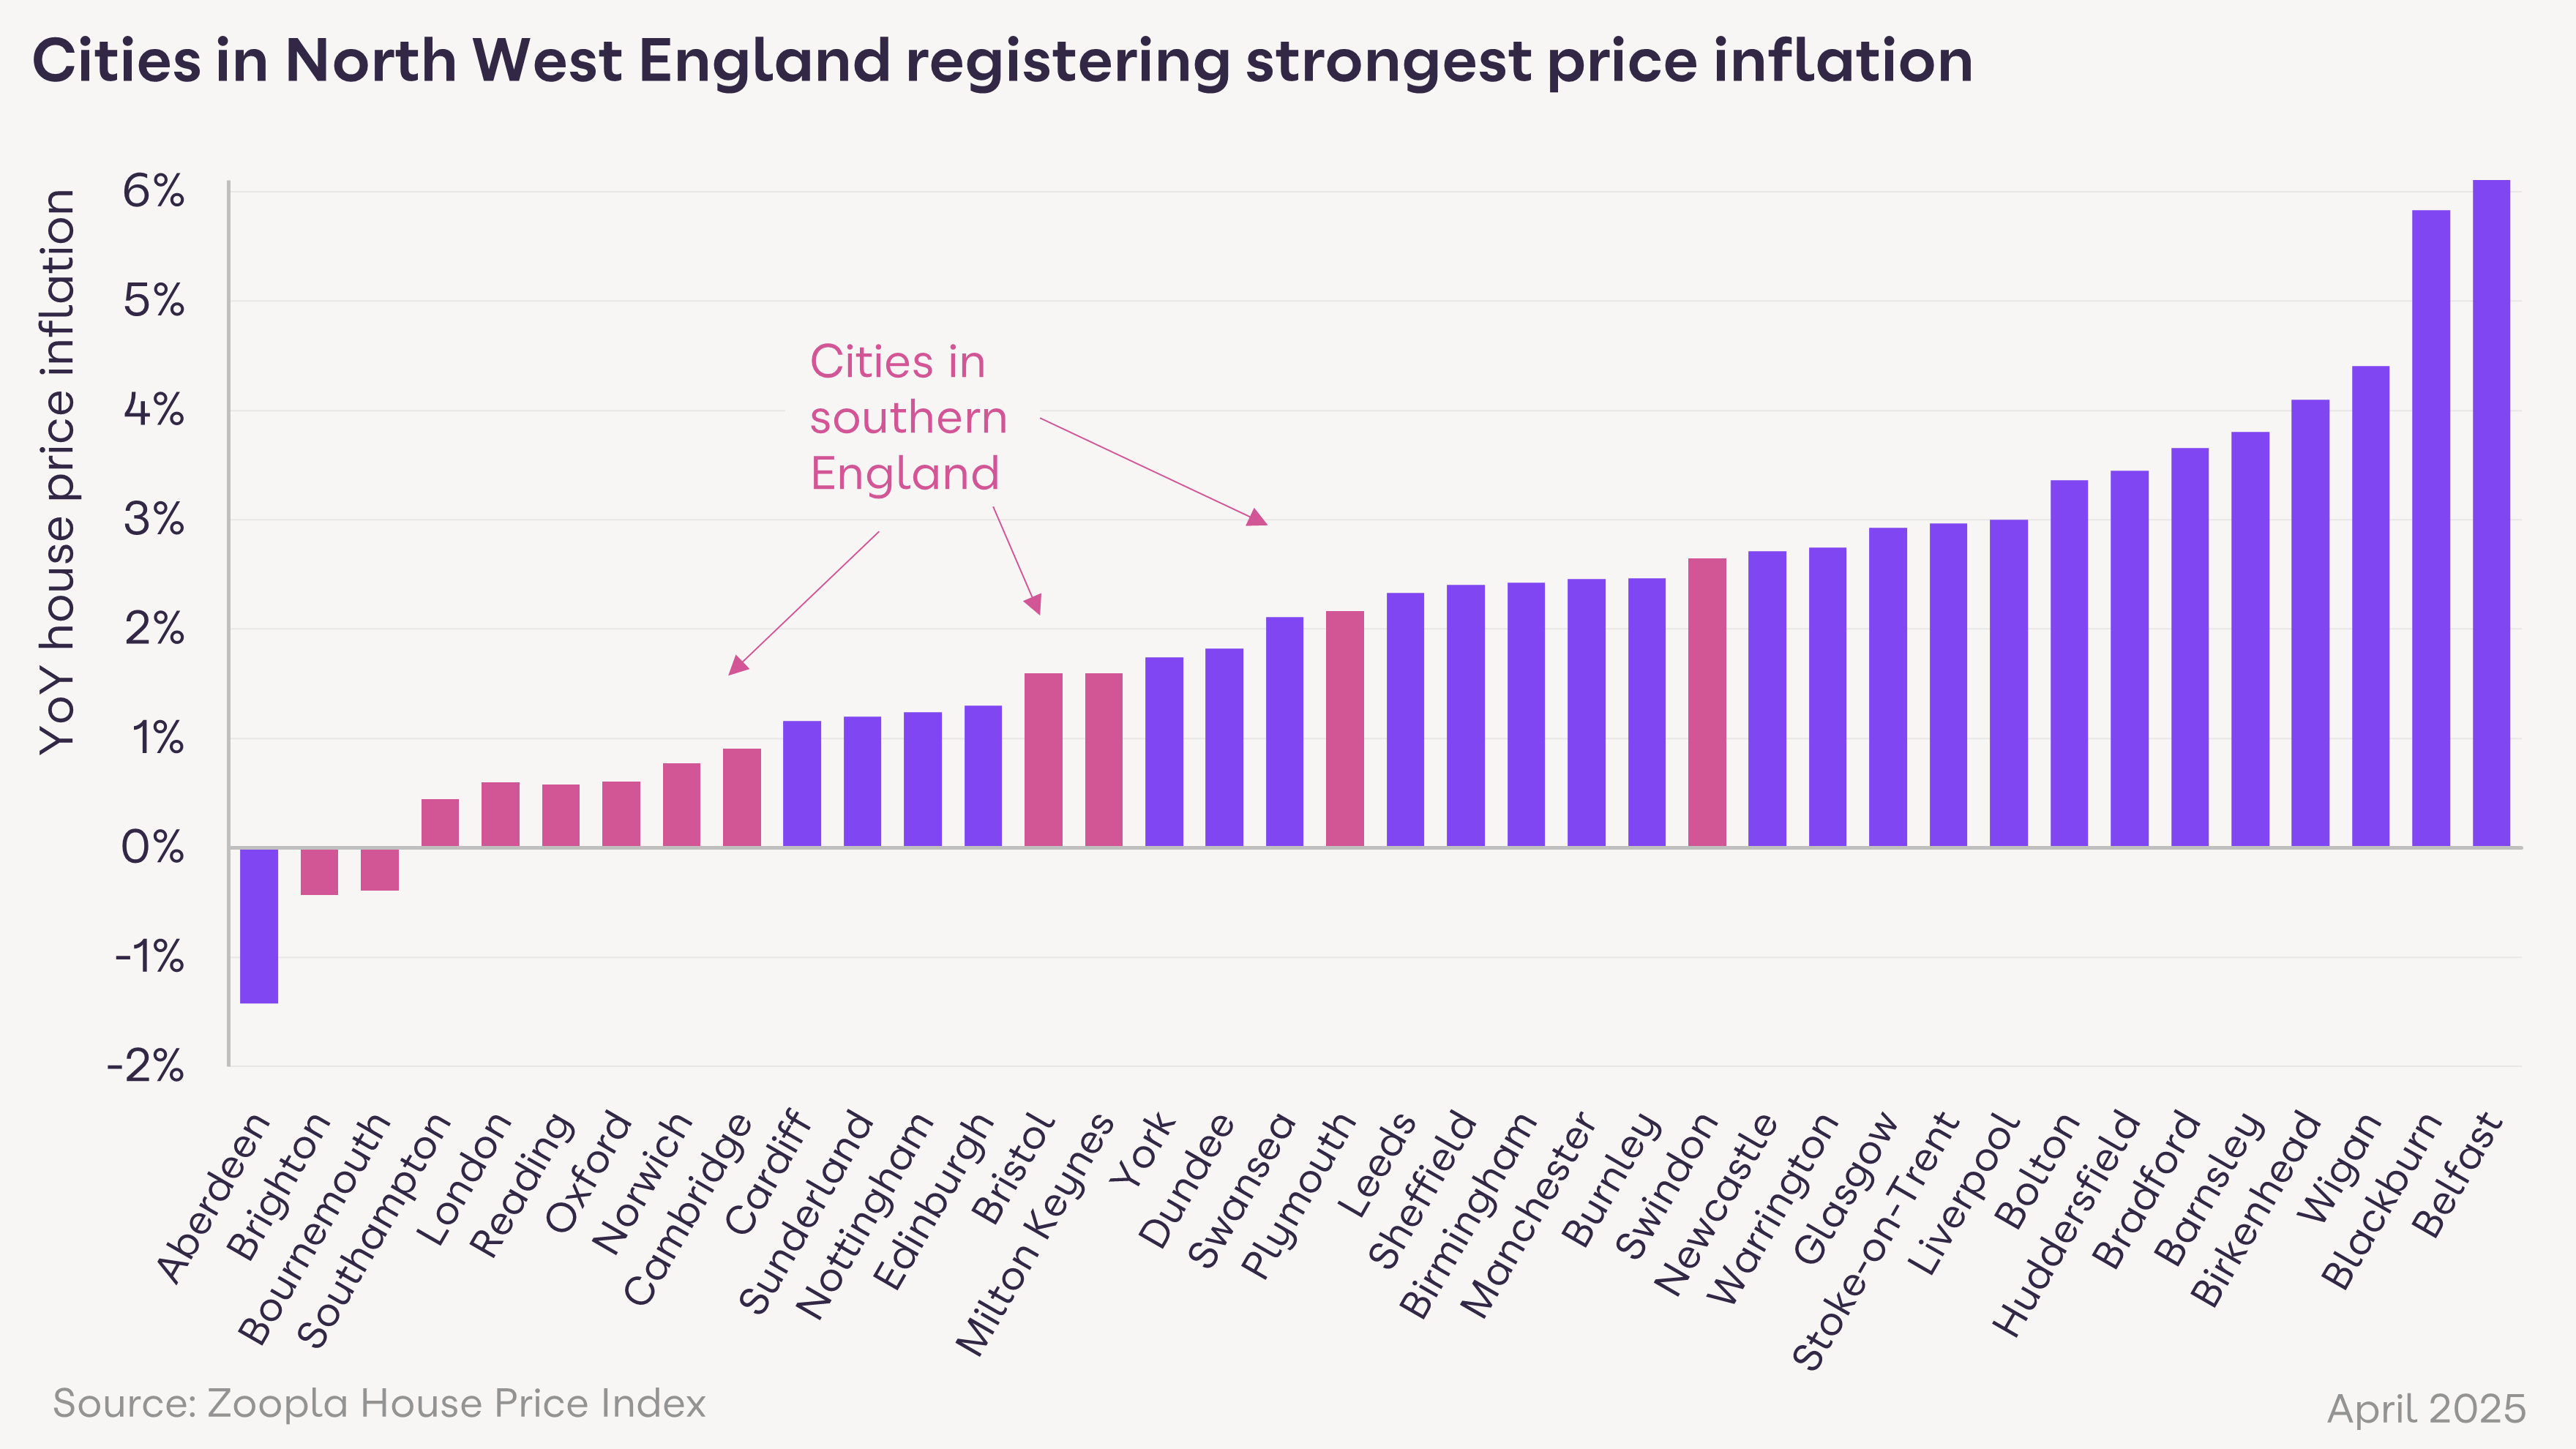
Price increases remain subdued in southern cities of England, where affordability remains a constraint on how much prices can rise. Aberdeen is under-performing the Scottish market because of weaker economic conditions due to low investment in the oil and gas industry.
We expect this variation in price inflation to continue over the rest of the year as home values rise in more affordable areas.
Outlook for the housing market in 2025: modest price gains and more sales
Strong competition in the mortgage market and less stringent affordability testing is set to support buyer demand and sales volumes over the second half of 2025.
The different trends in supply and demand across the country have important implications for how sellers approach the pricing of their homes if they are serious about selling in 2025. Buyers also need to adapt to local market conditions in how they pitch offers to buy.
Overall, the housing market is well set for 5% more sales in 2025 compared to last year, with just enough house price inflation to keep sellers and buyers entering the market and making bids for homes.
House Price Index May 2025: country, region and city summary
About our House Price Index
The Zoopla House Price Index (HPI) is a repeat sales-based price index, using sold prices, mortgage valuations and data for recently agreed sales. The index uses more input data than any other and is designed to accurately track the change in pricing for UK housing. It’s a revisionary index and non-seasonally adjusted.
Download the full House Price Index for May 2025 (PDF, 410.86kB).
Ready to get ahead?
Every 1.5 seconds a mover connects with an estate agent or housebuilder on Zoopla. See how your business can win with us.
We try to make sure that the information here is accurate at the time of publishing. But the property market moves fast and some information may now be out of date. Zoopla accepts no responsibility or liability for any decisions you make based on the information provided.