Zoopla Housing Market Rankings 2026
Insights
13 January 2026

Zoopla Market Rankings 2026

We’ve ranked every UK postcode area by its growth potential in 2026, based on key market indicators. How does your area stack up?

Richard DonnellExecutive Director – Research

Key takeaways

  • National averages are interesting but don’t explain local trends. In 2026, success will be dictated by hyper-local awareness and tailored sales strategies.

  • Scotland and the North West dominate the top 20 markets ranked for house price growth, while the South East and London require very careful pricing to ensure demand and move stock.

  • Time to sell is an important performance indicator for market health, revealing stark contrast between areas where homes sell in 14 days versus those sitting on the market for 60+.

There is no single housing market in the UK. Conditions vary across the country, from regions to individual towns, and a tailored local strategy is key to successful sales and agency growth in 2026.

The Zoopla Sales Market Rankings 2026 use definitive data and key market indicators to predict the strength of the sales market across 120 postcode areas in the coming year.

The aim? Arm you with detailed local market insights to help inform client conversations, win more instructions and secure sales to support your growth in your local market.

The Zoopla Sales Market Rankings 2026

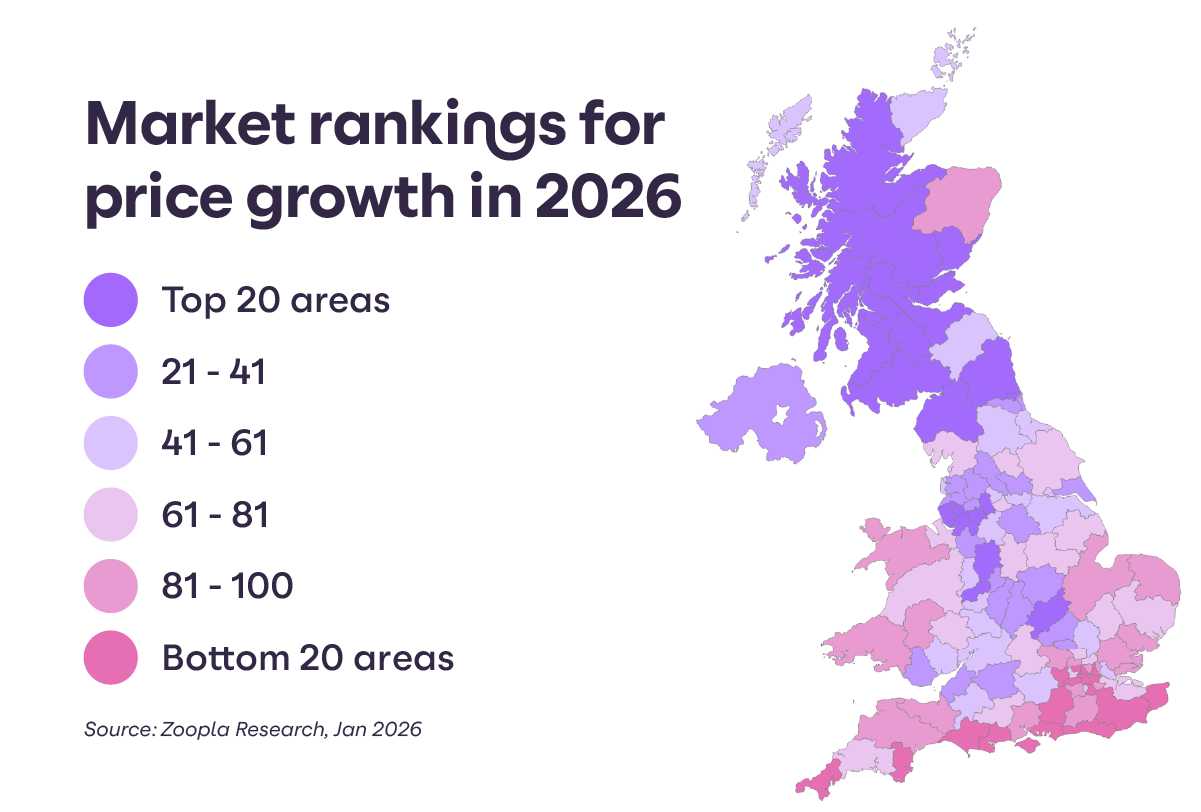
We predict that UK house prices are set to increase by 1.5% this year, but there will be a spread in the range of house price inflation across local markets. This will reflect the demand for and affordability of homes across the country, with markets in Scotland and Northern England enjoying the best prospects for growth.

The towns and cities at the top of the rankings are where homes remain affordable or accessible to large employment centres, giving scope for more sales and price inflation. House prices across these areas are below the UK average and there remains a general scarcity of homes for sale. 

UK rank

Postal area

Average house price

Annual price growth

Days to sell

% homes with asking price cut 5%+

% homes on market for 6m+

1

Motherwell

£134,700

3.4%

14

7%

8%

2

Glasgow

£163,600

3.0%

14

6%

4%

3

Paisley

£139,500

3.4%

17

7%

13%

4

Falkirk

£170,600

4.2%

14

5%

8%

5

Kirkcaldy

£171,400

4.2%

17

6%

13%

6

Edinburgh

£251,500

1.7%

14

6%

9%

7

Kilmarnock

£126,200

2.4%

22

11%

13%

8

Perth

£206,200

3.1%

25

8%

22%

9

Inverness

£207,100

3.5%

24

6%

23%

10

Wigan

£175,800

3.0%

32

9%

19%

11

Liverpool

£177,400

3.5%

33

7%

24%

12

Stoke-on-Trent

£189,800

2.8%

32

8%

23%

13

Wolverhampton

£208,700

3.2%

26

9%

20%

14

Newcastle upon Tyne

£167,700

2.8%

31

10%

20%

15

Carlisle

£184,500

4.0%

27

9%

22%

16

Dumfries

£151,800

1.3%

30

9%

24%

17

Dundee

£149,400

2.1%

27

12%

17%

18

Northampton

£260,100

0.7%

44

8%

20%

19

Oldham

£184,000

4.4%

37

10%

22%

20

Manchester

£224,700

1.9%

30

9%

25%

21

Warrington

£231,300

2.9%

37

9%

23%

22

Sunderland

£121,100

1.9%

34

12%

22%

23

Leeds

£224,800

2.3%

30

9%

23%

24

Bradford

£169,400

2.9%

33

11%

24%

25

Belfast

£192,700

6.5%

32

5%

30%

26

Preston

£204,600

2.7%

31

9%

26%

27

Bolton

£197,300

2.6%

33

10%

23%

28

Sheffield

£180,600

2.1%

30

11%

22%

29

Coventry

£263,400

1.3%

35

9%

22%

30

Hull

£151,900

0.5%

41

9%

27%

31

Durham

£146,400

1.7%

23

14%

20%

32

Walsall

£222,500

3.1%

26

9%

22%

33

Blackburn

£157,400

3.9%

35

11%

21%

34

Birmingham

£234,900

1.2%

31

9%

26%

35

Cardiff

£217,400

2.1%

36

9%

25%

36

Bristol

£342,400

0.8%

22

9%

19%

37

Crewe

£248,400

2.6%

37

9%

25%

38

Swindon

£306,900

0.8%

38

10%

22%

39

Milton Keynes

£332,700

1.0%

31

10%

23%

40

Leicester

£256,800

1.4%

59

9%

24%

41

Luton

£300,300

1.1%

37

9%

25%

42

Newport

£209,500

2.4%

36

10%

27%

43

Worcester

£301,500

2.2%

29

9%

26%

44

Galashiels

£186,600

4.7%

35

8%

28%

45

Kirkwall

£164,800

3.0%

41

10%

29%

46

Stevenage

£404,000

1.3%

43

8%

24%

47

Wakefield

£181,700

2.8%

36

10%

24%

48

Dudley

£229,700

2.4%

40

9%

26%

49

Doncaster

£164,700

1.7%

40

10%

29%

50

Stockport

£288,200

2.9%

40

8%

28%

51

Halifax

£184,200

3.7%

35

12%

25%

52

Blackpool

£156,400

2.5%

42

9%

30%

53

Romford

£374,300

0.7%

41

11%

18%

54

Teesside

£138,000

2.2%

38

12%

25%

55

Reading

£413,400

0.5%

35

11%

22%

56

Darlington

£157,200

2.3%

36

11%

28%

57

Telford

£226,800

0.8%

42

7%

32%

58

Sutton

£456,000

0.3%

36

11%

20%

59

Bath

£329,600

0.0%

35

12%

23%

60

Hebrides

£156,800

1.4%

40

10%

59%

61

Gloucester

£328,100

0.8%

34

10%

27%

62

Dartford

£375,100

0.6%

43

11%

20%

63

St Albans

£521,800

1.0%

43

9%

26%

64

Uxbridge

£423,800

0.3%

48

6%

32%

65

Enfield

£444,300

0.7%

41

7%

29%

66

Harrogate

£340,700

0.5%

38

10%

28%

67

Shrewsbury

£264,000

1.4%

47

9%

38%

68

Nottingham

£214,200

0.8%

35

13%

25%

69

Huddersfield

£195,800

2.1%

38

12%

26%

70

Chester

£217,000

2.6%

44

12%

27%

71

Medway

£310,900

0.5%

40

14%

21%

72

Derby

£225,000

2.3%

42

10%

28%

73

Oxford

£411,100

0.9%

41

12%

25%

74

Cambridge

£407,900

0.1%

42

11%

24%

75

Salisbury

£338,100

1.0%

45

10%

25%

76

Ipswich

£289,700

0.3%

47

11%

27%

77

Lancaster

£224,700

1.3%

39

11%

31%

78

York

£260,000

1.3%

39

10%

35%

79

Lincoln

£214,800

1.8%

48

10%

40%

80

Plymouth

£250,700

0.7%

51

12%

31%

81

Hereford

£295,400

1.5%

46

9%

37%

82

Taunton

£280,000

0.8%

42

10%

34%

83

Southampton

£333,100

-0.2%

38

12%

28%

84

Southend-on-Sea

£344,800

1.0%

45

13%

22%

85

Llandudno

£206,000

1.7%

53

11%

44%

86

Ilford

£441,600

0.5%

49

11%

26%

87

Swansea

£196,400

2.3%

49

12%

37%

88

Hemel Hempstead

£448,800

1.0%

44

10%

27%

89

Peterborough

£244,000

0.2%

40

11%

34%

90

Redhill

£437,600

0.3%

44

12%

26%

91

Colchester

£295,900

-0.1%

44

13%

27%

92

Llandrindod Wells

£251,000

2.4%

51

10%

44%

93

Watford

£488,100

0.4%

62

10%

28%

94

Kingston upon Thames

£583,900

-0.3%

41

11%

28%

95

Chelmsford

£408,500

0.6%

41

11%

26%

96

Norwich

£260,300

0.1%

42

15%

30%

97

Bromley

£515,700

0.2%

46

14%

24%

98

Aberdeen

£161,100

0.5%

40

17%

34%

99

North London

£578,000

0.2%

44

12%

27%

100

Exeter

£305,000

-1.7%

42

12%

39%

101

South East London

£464,200

-0.5%

51

14%

30%

102

Slough

£493,600

-0.5%

50

10%

33%

103

Portsmouth

£291,800

-1.1%

41

13%

32%

104

Guildford

£468,500

0.3%

49

14%

26%

105

East London

£472,600

-0.6%

42

13%

32%

106

Croydon

£397,300

-0.3%

47

14%

28%

107

Twickenham

£503,000

0.4%

50

11%

30%

108

Harrow

£505,300

-0.3%

50

11%

33%

109

Truro

£311,300

-2.4%

54

12%

42%

110

Bournemouth

£343,600

-1.8%

48

12%

36%

111

Dorchester

£319,600

-1.3%

43

13%

33%

112

Canterbury

£298,400

-1.2%

59

18%

32%

113

Torquay

£286,100

-1.9%

51

14%

41%

114

Brighton

£367,600

-1.1%

36

15%

29%

115

Tunbridge Wells

£401,400

-0.6%

50

14%

34%

116

North West London

£621,700

-2.0%

53

12%

39%

117

South West London

£706,900

-0.8%

50

15%

36%

118

East Central London

£682,400

-4.5%

67

14%

47%

119

West London

£747,100

-1.5%

54

14%

43%

120

West Central London

£797,600

-1.8%

82

14%

51%

Kevin Shaw, National Sales Managing Director at Leaders Romans Group, shared his thoughts on the rankings:

“England is a patchwork of micro-markets. Every region has value pockets and premium pockets, and changing work patterns are widening where people feel they can live.

“In this report we can see ‘levelling up’ playing out and reflected in practical decisions (the political rhetoric having been forgotten). Better connectivity, stronger local economies and more flexible working post-Covid are widening options for buyers, renters and employers alike. In many cases, it makes the length and breadth of the country an option regardless of where employment HQs are located.

“In 2026, the winners won’t be regions - they’ll be the households that understand their local market and move decisively."

Stop guessing and start growing. Our team can help handpick the right products to win more customers in your local market.

How to use this data in your next pitch

High-ranking markets: Sell into existing demand at the right price

These are affordable markets where homes sell quickly and buyer demand is strong. This creates headroom for prices to continue rising at an above-average pace.

  • Buyer demand is resilient and broad-based

  • Homes are selling faster than the UK average

  • Pricing accurately still matters, but market momentum supports sellers.

At valuations, emphasise the strength of your market with sellers securing strong interest and smooth sales. Show evidence of recent achieved prices, highlight speed of sales as a sign of demand strength, and explain how realistic pricing secures competition and avoids lost momentum. Reassure homeowners that they’ll be selling into existing demand - not waiting for it.

Mid-ranking markets: Attract early demand to sell in a balanced market

These are balanced markets with steady demand and normal selling times. Prices can rise gradually, but only where homes are priced realistically from the outset.

  • Demand exists, but it’s value-driven

  • Longer selling times are normal

  • Price cuts common when the initial pricing is set too high

  • Achieved prices depend on first impressions and listing quality

When pitching to clients, get across the benefit of pricing competitively to attract early demand. Explain that the market is adjusting to higher mortgage rates and reduced buying power, which makes buyers price-sensitive while they also have more choice, and the risk of overpricing can lead to a slower sale and a weaker final price. Demand has not disappeared - it is simply more selective - and the right sales strategy will protect the final result.

Low-ranking markets: Adjust expectations and prioritise pricing

Housing markets across Southern England and London make up the list of the areas at the bottom of the rankings across the UK. This is largely down to affordability pressures resulting from higher house prices and the fact the market is still adjusting to higher mortgage rates. These markets have also seen a greater increase in homes for sale, boosting buyer choice, and with higher stamp duty costs since April 2025. This explains the modest decline in average prices over the last year. 

These higher-priced markets make buyers more cautious, lengthening sale times. Price growth is slower and sellers need to adjust expectations to secure a sale.

  • Buyers are active but selective

  • Well-priced homes still attract good interest

  • Overpriced homes sit and then underperform

  • Micro-location matters more than headline trends

Show evidence of recent achieved prices and use sale speeds to show demand strength in your local area. Realistic pricing will secure competition and avoid lost momentum, particularly in a steady market. It’s a workable market, not a weak one, and that’s where the right pricing and marketing strategy matter most. Homes that are well-presented and priced realistically will continue to sell, but optimistic pricing might take longer and require later reductions, which can be detrimental to the final result.

We try to make sure that the information here is accurate at the time of publishing. But the property market moves fast and some information may now be out of date. Zoopla accepts no responsibility or liability for any decisions you make based on the information provided.

Related articles

Colourful houses

Zoopla House Price Index: December 2025

19 Dec 2025

We expect a stronger than usual start to 2026 as buyers return to the market. The appetite to move home remains strong but affordability remains a constraint for those buying their first home or looking to trade-up to a larger home, which will keep prices in check.

Read more
Largest sales pipeline for 4 years

A £100bn opportunity: recovery in sales market drives strongest pipeline in 4 years

29 Oct 2025

The UK sales market has registered a strong recovery over the last two years, with agents now managing the largest sales pipeline since 2021.

Read more