Zoopla House Price Index May 2026
Sales are outpacing what demand levels alone would suggest and first-time buyers are raising budgets without lowering expectations. The fundamentals are stable but the outlook remains finely balanced with fewer active buyers in the market.
Key takeaways
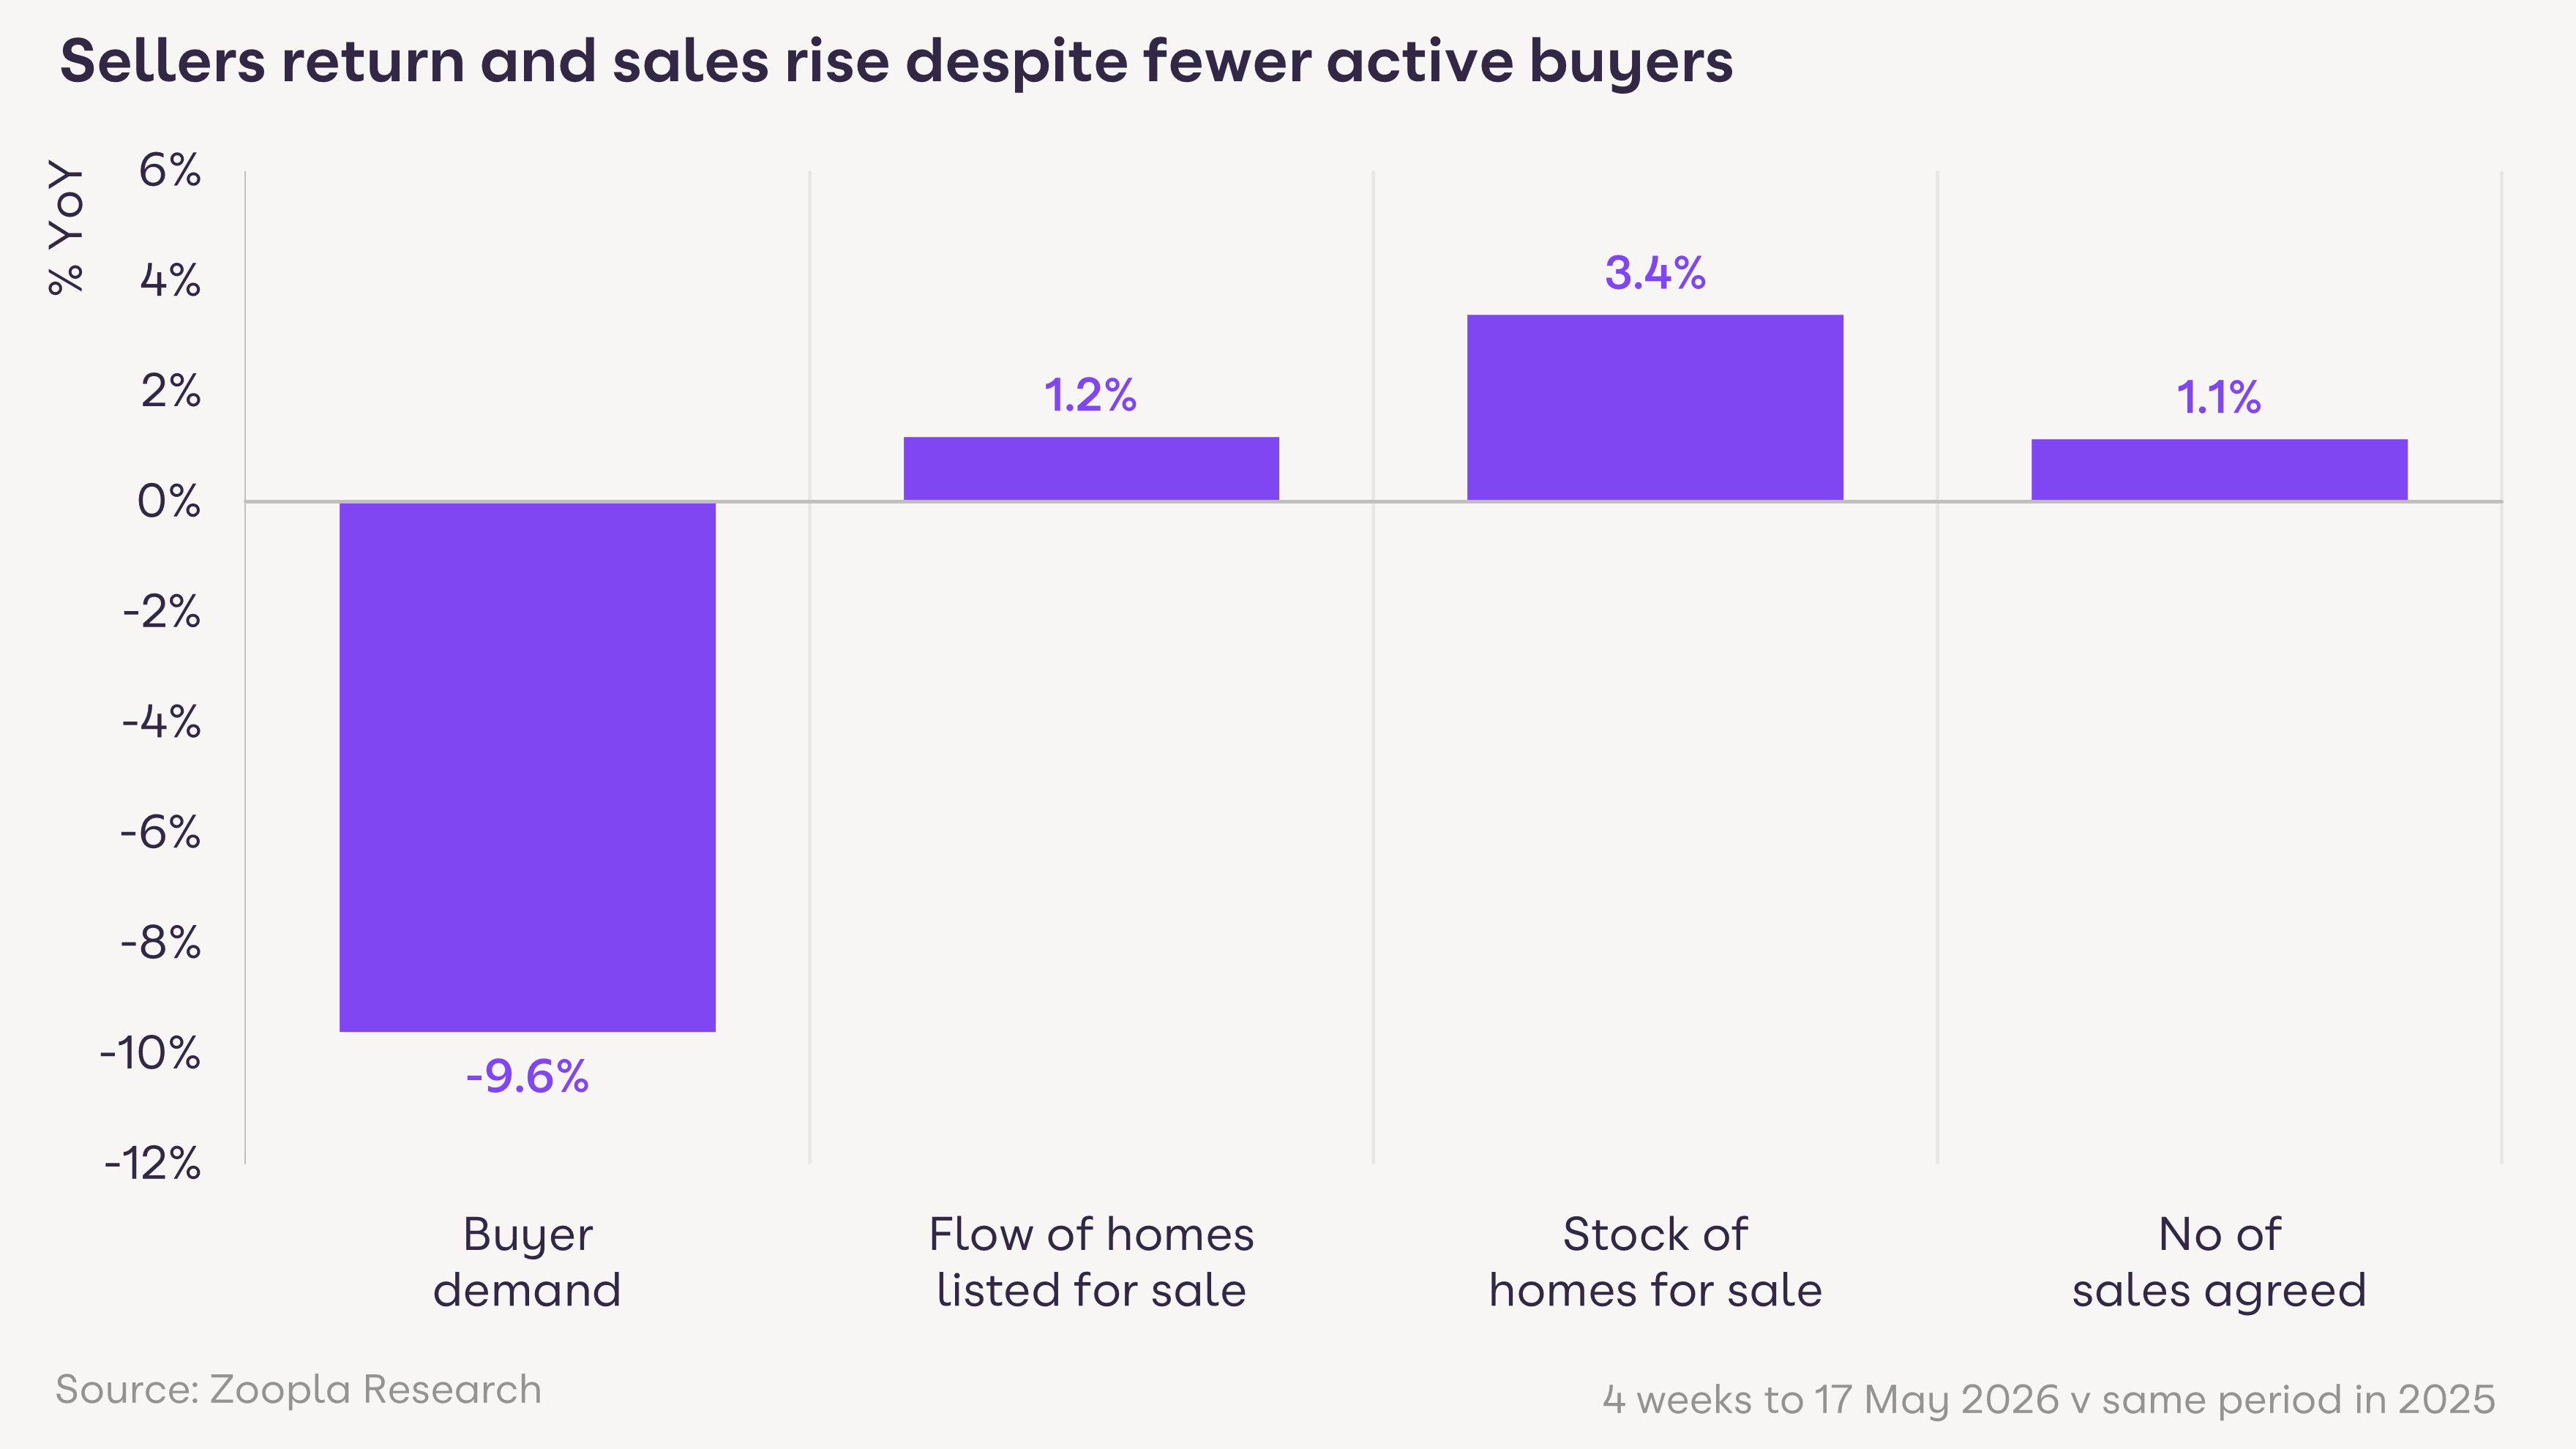
Demand is down while sales are up, highlighting a thinner but more motivated buyer pool and the importance of ready-to-move applicants
First-time buyers are looking to buy homes priced 4.3% higher than a year ago - nearly 3 times the headline figure - with no change in what they want to buy
Mortgage rates have partially recovered and buyers who are still active have priced this into their budgets
More sellers are coming to market despite the uncertain backdrop - accurate pricing remains key
We break down the key conversation points from this data for conversations with first-time buyers, home-movers and sellers
Join Zoopla for the data, tools and leads that make the difference in a finely balanced market
The divergence of committed movers driving completions while discretionary buyers step back in the face of increased uncertainty is the defining dynamic of the 2026 market so far. Buyer demand is down 10% year-on-year, yet sales agreed are tracking 1% ahead - the first annual increase in 8 months.
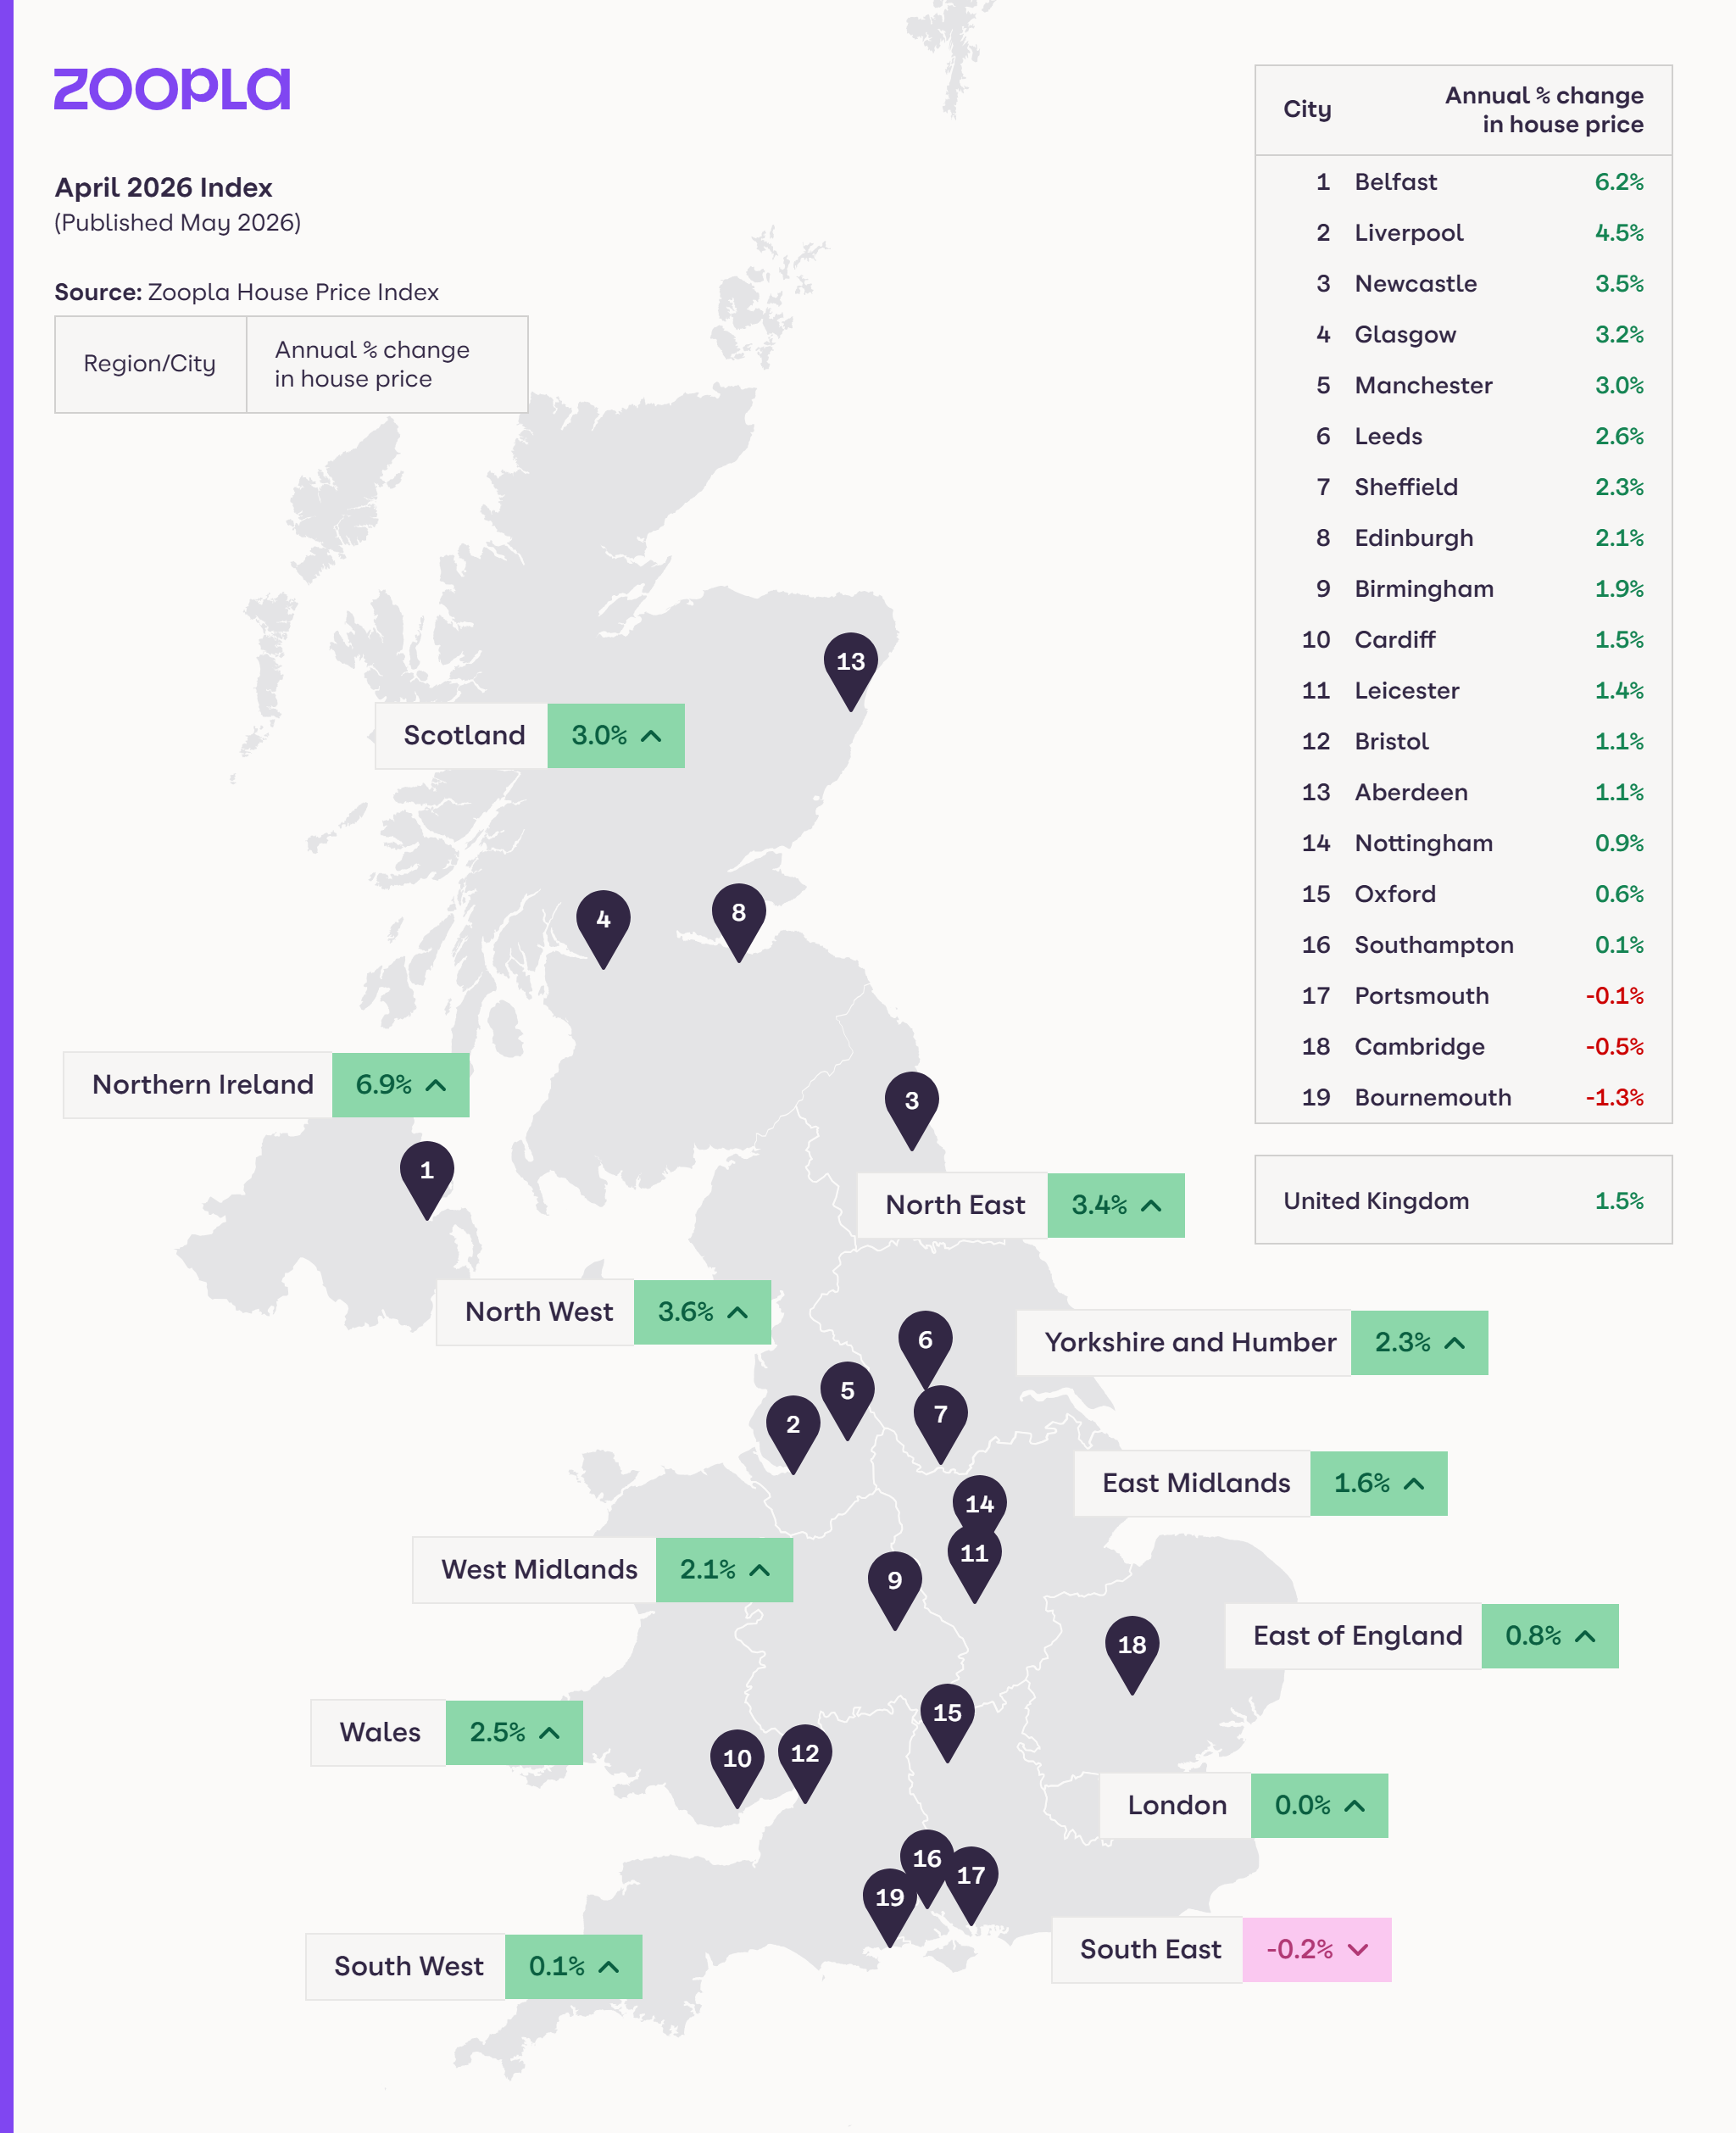
First-time buyers are looking to buy homes priced at nearly 3 times the headline 1.5% rate, and supply is building in southern markets while northern stock is being absorbed quickly. Pricing accuracy and local intelligence remain the key levers to win business and complete sales.
Download the House Price Index, May 2026 (PDF, 360kB)
Property type | Average house price February 2026 | Average house price March 2026 | Average house price April 2026 | Annual price change to April 2026 (£) | Annual price change to April 2026 (%) |
All property | £271,000 | £271,700 | £271,900 | £4,030 | 1.50% |
Flats/maisonettes | £192,400 | £192,500 | £193,000 | -£2,540 | -1.30% |
Terraced houses | £240,700 | £240,800 | £241,600 | £4,120 | 1.70% |
Semi-detached houses | £280,700 | £280,600 | £281,800 | £6,750 | 2.50% |
Detached houses | £457,000 | £456,800 | £458,700 | £7,480 | 1.70% |
First-time buyer demand: fewer active, higher price thresholds
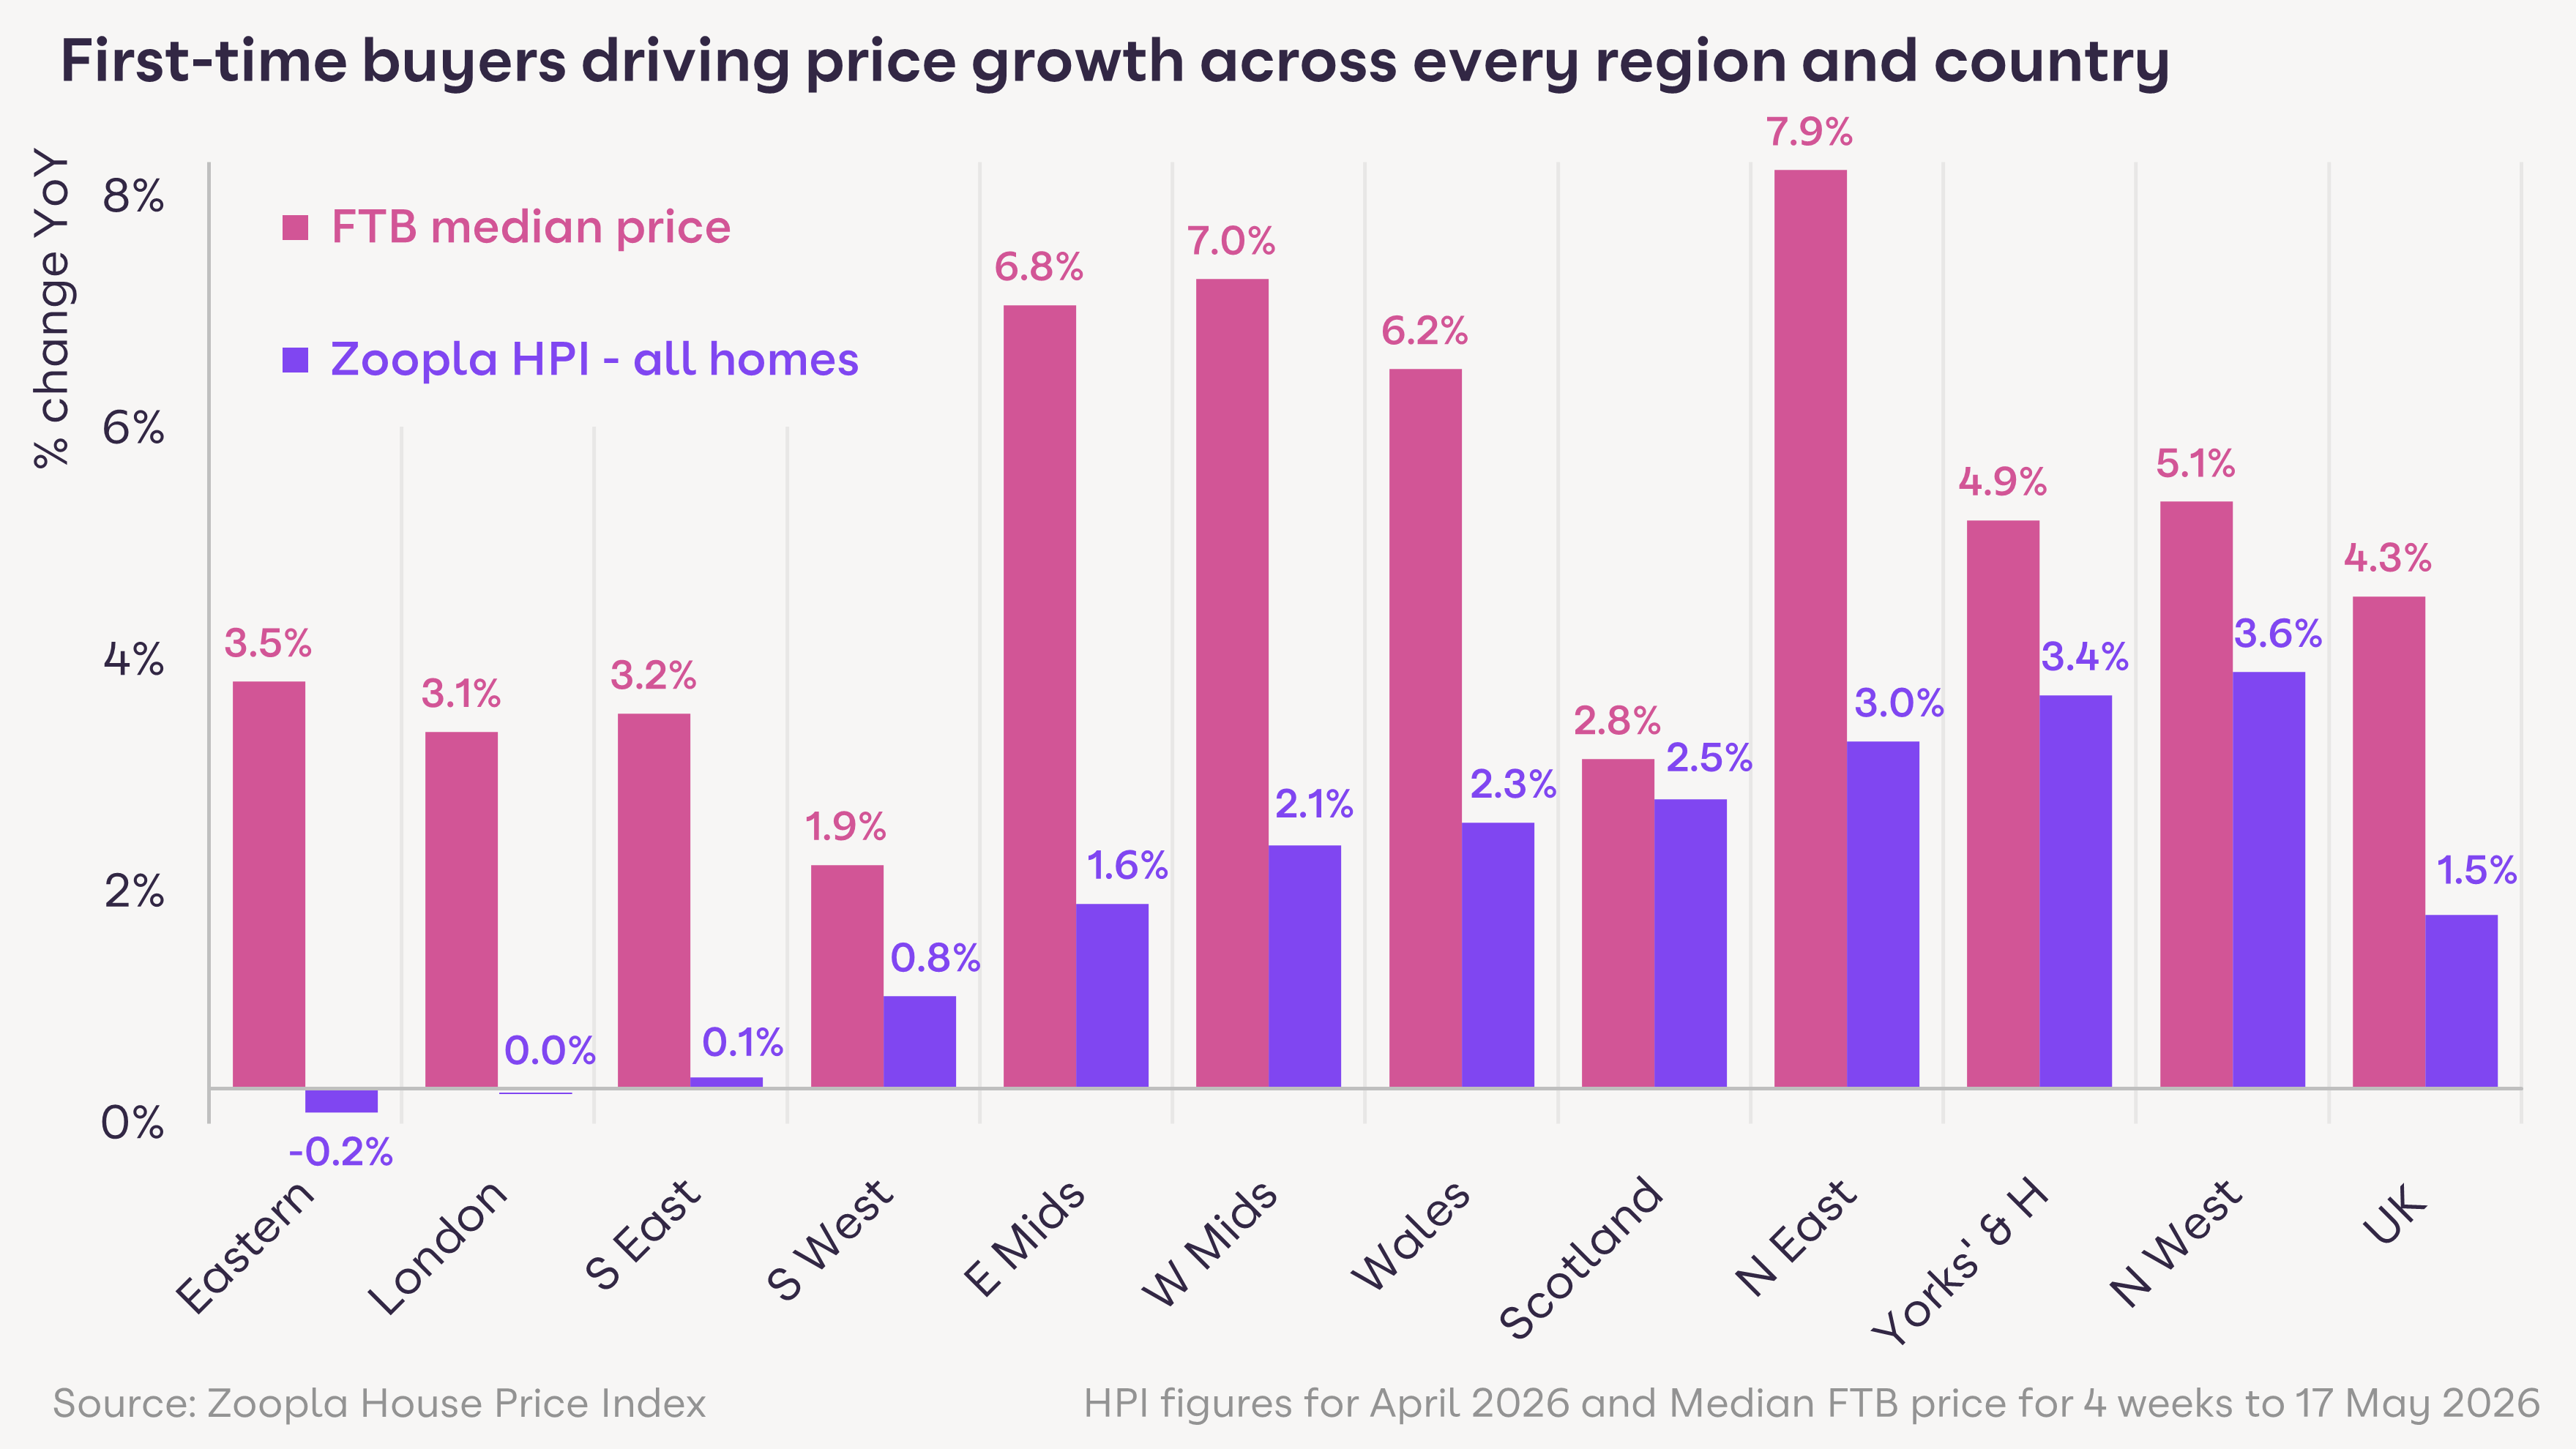
First-time buyer enquiries are running 6% below last year but those who remain active are targeting more expensive stock.
The average first-time buyer asking price nationally is now £254,750, up 4.3% year-on-year. Scotland is up 8% and the West Midlands is up 7%.
In London, the first-time buyer threshold has crossed £500,000 for the first time. Active buyers are targeting homes priced £15,000 above last year on average, despite flat overall sale prices in the capital.
Mortgage affordability rule changes introduced in 2025 have expanded the accessible price range for first-time buyers. This is feeding through into entry-level price inflation ahead of wider market trends.
For housebuilders setting pricing and incentives, this upward pressure on first-time buyer thresholds shows buyers are not trading down or accepting compromise. The 53% targeting 3-bed houses outside London is unchanged year-on-year, as is the 53% targeting flats in London.
The practical implication is that price positioning at the entry-level end of the market can reflect genuine demand-side pressure.
Join Zoopla to access 6m+ homeowners
Connect with our homeowner audience to win more instructions and grow your market share.

Sales vs demand divergence: what it means for your pipeline
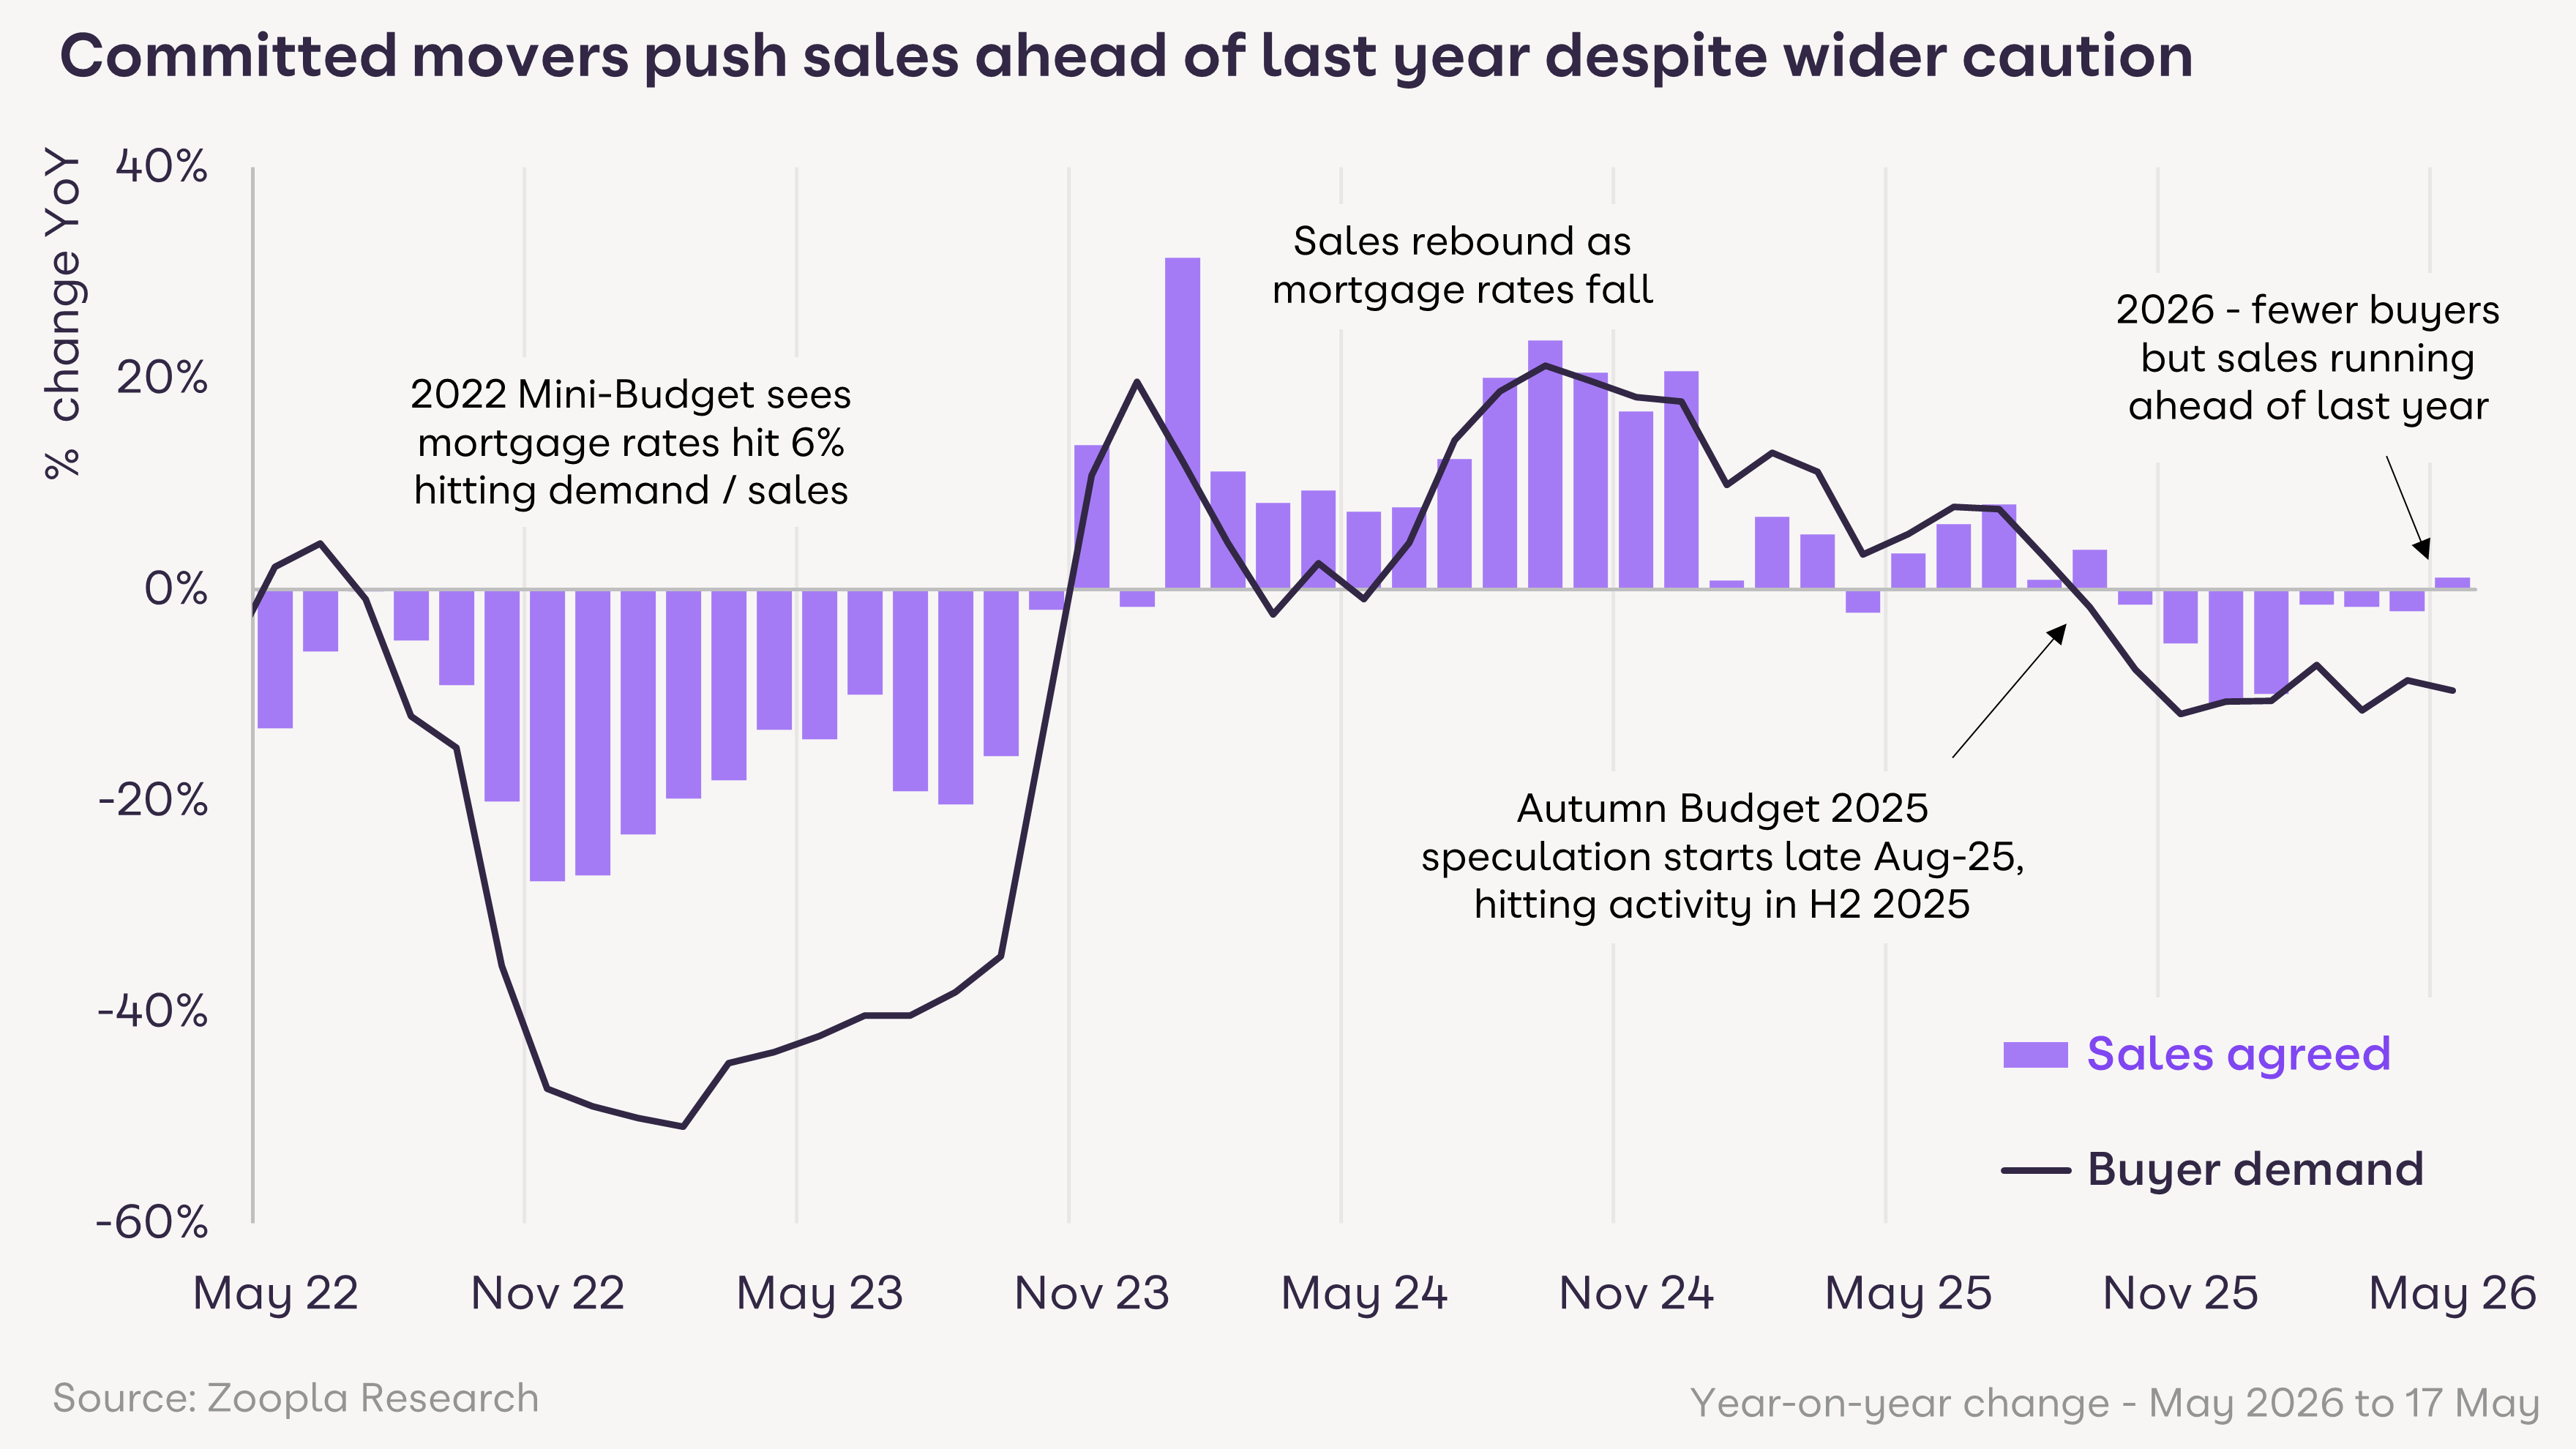
The gap between demand (−10%) and sales agreed (+1%) is not unusual. It followed the same pattern post the 2022 mini-budget and ahead of the 2025 Autumn Budget.
On both occasions, transaction volumes proved more resilient than enquiry levels suggested. The current market is following the same pattern.
For agents, this means the active buyer pool is smaller but higher intent. Qualified, chain-ready applicants are the priority to identify and support.
More stock is coming to market, a signal that households are progressing decisions despite uncertainty. This supports forward sales pipelines but also increases the importance of a competitive listing strategy for agents managing vendor expectations.
For housebuilders, reservation rates on well-priced plots are holding; the challenge is avoiding overhang on schemes where pricing was set under earlier market assumptions.
Regional picture: 2-speed market with clear implications by patch
Northern England, Scotland and Wales are seeing price growth of 2% to 3.6%, driven by improved affordability in markets where mortgage changes have had the most impact.
The North East is the stand-out. Sales agreed are up 6% year-on-year against a 20% fall in buyer demand, the sharpest demand decline of any region. With no corresponding increase in available stock, supply is being absorbed fast and the result is above-average price growth despite the weakest demand picture.
London tells a different story. Sales agreed are up 8% - the strongest of any region - after 6 consecutive months of modest price falls. But available stock is up 13% year-on-year. Price inflation has stabilised and the buyer pool has widened, but so has choice. Vendors expecting 2024-style pricing need to be managed carefully.
Across southern England more broadly, the pattern is more homes for sale, slower decisions and selective buyers.
Speak to our team to get started and grow faster in your local market.

Outlook for the second half of 2026
We expect house price inflation to hold around 1.5% nationally and the North/South divide is likely to persist.
Mortgage rates are expected to remain above January levels, having spiked from 4% to 5% between January and April. This means the affordability boost from rate cuts in late 2024 has partially reversed, although buyers now benefit from the easing in mortgage stress testing easing last year.
The key risks are higher mortgage rates or a jump in the cost of living that hits broader consumer confidence, particularly given ongoing uncertainty from events in the Middle East. Market conditions could deteriorate if either factor moves adversely.
The upside scenario is that more sellers entering the market supports transaction volumes even in a lower-demand environment, and committed movers continue to transact. The market can sustain current activity levels if stock is priced correctly and buyer finance is in place.
Using this data in client conversations
The market looks different depending on who you're talking to: here's how to use the data with each audience.
With first-time buyers
Conditions are better than 18 months ago with more choice, motivated sellers and some rate recovery, but there is hesitancy, with first-time buyer demand down 6%.
The conversation to have is around affordability clarity rather than market timing. Push them toward a mortgage broker before they're ready to offer; the ones who've done that are the ones transacting.
With home-movers
Well-priced stock is selling at the same pace as last year, which is a genuinely reassuring message. The risk is vendors who conflate ‘the market is moving’ with ‘I can push on price.’
Use the demand data to set realistic expectations early, as accurate pricing at instruction is what's separating completions from stale listings right now.
With sellers in London and the South
Stock is up 13% in London, buyers have choice and they're taking longer to commit. Lead with the overpricing risk as a reduction after launch is more damaging than pricing correctly at the start, and the data backs that up. Serious buyers are active, but they won't overpay when alternatives exist.
About the Zoopla House Price Index
The Zoopla House Price Index (HPI) is first published on Zoopla.co.uk and tracks the change in achieved sales price of homes. It’s not an index that tracks asking prices. It uses sold prices, mortgage valuations and data for recently agreed sales with more input data than any other index. The methodology is designed to accurately track the change in pricing for UK housing. It is revisionary and non-seasonally adjusted.
Notes on this month’s data:
Overall buyer demand is running 10% below last year: 4 weeks to 17 May 2026 vs same period in 2025.
First-time buyer data on average prices and price changes is based on enquiries to estate agents and homebuilders in the 4 weeks to 17 May 2026 vs same period in 2025.
Average mortgage rates jumped from 4% at the start of the year to 5% in April: Average mortgage rate for a 75% loan to value 5-year fixed rate loan - Bank of England, Bankstats. Change in UK homes listed for sale versus last year: +3.4%.
We try to make sure that the information here is accurate at the time of publishing. But the property market moves fast and some information may now be out of date. Zoopla accepts no responsibility or liability for any decisions you make based on the information provided.
Related articles


Half of UK homes aren’t selling - it’s time to address pricing expectations
14 May 2026With unrealistic pricing by sellers the key reason homes are unlikely to sell, our latest research explores how agents might help reset their expectations and win instructions rooted in achievable pricing.
Read more