Charge up your property listings
17 Jun 2025Get your listings ready for our new EV charging point filter, coming July 2025.
Read more
Find out how much house prices have increased in your area, and how you can turn this into an opportunity to win more instructions.
UK house prices have increased by an average of 74% over the last 20 years, from £113,900 to £268,200
52% of Brits have said they would consider moving back to the area where they grew up
South East and Eastern England have seen a significant jump in house prices, increasing by 87% in both regions
House prices in the North East have increased by 39%, the smallest increase in the UK over the last 20 years
Over the last 20 years, UK house prices have grown by an average of 74%, rising from £113,900 to £268,200. In high-growth regions, many homeowners may be unaware of just how much their property has appreciated.
While the house price-to-earnings ratio has remained broadly the same at 6.4, the increase in house prices means that moving home now feels unaffordable for many.
With 52% of Brits saying they’d consider moving back to their hometown, this represents a huge, untapped pool of potential buyers and sellers. Launching targeted marketing campaigns for former residents of your area who now live elsewhere, but might be interested in returning, is a good way to generate new leads.
While house prices in London have increased significantly by 119%, the East and South East of England have also seen a big jump, increasing by 87% in both regions. House price to earnings ratios have also increased in both regions, from 7.8 to 8.6 in the South East and 7.1 to 7.7 in Eastern England.
Region
| Avg house price in 2025 | Avg house price in 2005 | Percentage increase |
London | £534,400 | £244,200 | 119% |
South East | £385,400 | £206,100 | 87% |
Eastern England | £337,500 | £180,600 | 87% |
South West | £312,000 | £179,300 | 74% |
East Midlands | £231,000 | £136,100 | 70% |
West Midlands | £233,700 | £139,800 | 67% |
Wales | £206,500 | £125,600 | 64% |
Scotland | £168,000 | £103,100 | 63% |
North West | £200,800 | £126,300 | 59% |
Yorkshire and the Humber | £190,400 | £121,200 | 57% |
North East | £146,400 | £115,800 | 26% |
In the South East, Elmbridge in Surrey has seen the biggest growth at 110%, with average house prices up from £338,800 to £712,700. The town is an attractive location for buyers with families due to the area's excellent transport links to London and picturesque countryside lifestyle. Southampton in Hampshire has seen the lowest increase in the region over the last 20 years, with house prices up 63% from £138,500 to £225,500. If you’re an agent, make sure you’re highlighting the excellent lifestyle these areas have to offer.
In Eastern England, average house prices in St Albans have seen the most significant increase in the region since 2005 at 108%, up from £298,600 to £622,100. Just 25 miles away from London, the city is popular with commuters as well as history enthusiasts, due to its spectacular cathedral and Roman architecture.
Like the South East, there are more affordable pockets in Eastern England, with the popular coastal town Great Yarmouth seeing the lowest growth in average house price increases in the region over the last 20 years, up 77% from £105.900 to £187,700.
Tap into our well-known brand, unique audiences and pipeline of motivated movers.

Agents in these areas should proactively prospect potential vendors and highlight the gains they could make if they decide to sell.
Region
| Local authority
| Current price | Price in 2005 | % increase | £ increase |
London | Kensington and Chelsea | £1,130,400 | £504,000 | 124% | £626,400 |
South East | Elmbridge | £712,700 | £338,800 | 110% | £373,900 |
Eastern England | St. Albans | £622,100 | £298,600 | 108% | £323,500 |
South West | Cotswold | £458,800 | £255,700 | 79% | £203,100 |
North West | Trafford | £349,300 | £196,100 | 78% | £153,200 |
East Midlands | South Northamptonshire | £381,600 | £214,300 | 78% | £167,300 |
Scotland | Edinburgh | £276,800 | £160,100 | 73% | £116,700 |
Wales | Monmouthshire | £335,800 | £197,500 | 70% | £138,300 |
West Midlands | Stratford-on-Avon | £382,000 | £225,800 | 69% | £156,200 |
Yorkshire and the Humber | Harrogate | £349,300 | £216,000 | 62% | £133,300 |
North East | Northumberland | £189,800 | £136,900 | 39% | £52,900 |
Buyers looking to move back to their hometown in the North East may find that this is more achievable than those looking to move back home elsewhere. Average house prices have increased by just 39%, the smallest increase across all regions. House price to earnings ratios have improved the most in the region compared to the rest of the UK, falling from 5.7 to 4 over the last twenty years.
When speaking to potential buyers, agents should highlight those areas with good value for money.
Region
| Local authority
| Current price | Price in 2005 | % increase | £ increase |
London | Barking and Dagenham | £338,000 | £165,000 | 105% | £173,000 |
Eastern England | Great Yarmouth | £187,700 | £105,900 | 77% | £81,800 |
Wales | Blaenau Gwent | £133,700 | £80,100 | 67% | £53,600 |
South East | Southampton | £225,500 | £138,500 | 63% | £87,000 |
West Midlands | Stoke-on-Trent | £136,400 | £86,800 | 57% | £49,600 |
South West | Plymouth | £207,200 | £133,000 | 56% | £74,200 |
East Midlands | Lincoln | £175,200 | £113,000 | 55% | £62,200 |
Yorkshire and the Humber | Hull | £115,100 | £77,000 | 49% | £38,100 |
Scotland | East Ayrshire | £109,500 | £79,500 | 38% | £30,000 |
North West | Blackpool | £124,300 | £98,400 | 26% | £25,900 |
North East | Sunderland | £124,000 | £101,600 | 22% | £22,400 |
Get first access to serious sellers and connect with top-quality prospects to grow your market share.

The UK’s most serious sellers use MyHome — secure these high-converting prospects before your competition does.
Win in the living room: see your prospect’s price expectations, their property searches and which agents you’re up against.
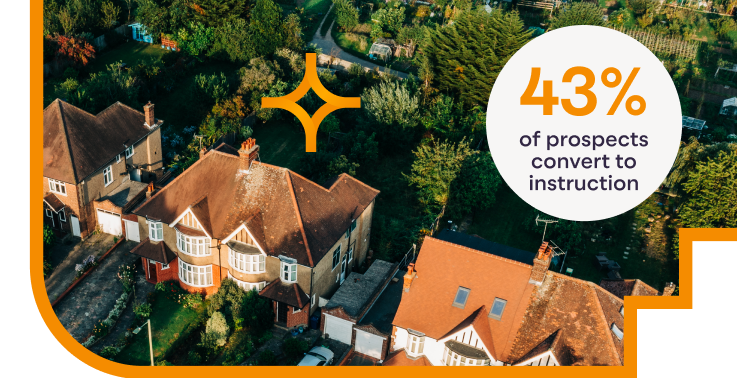
43% of these prospects convert to instruction, fuelling faster sales and boosting your commission revenue.
We try to make sure that the information here is accurate at the time of publishing. But the property market moves fast and some information may now be out of date. Zoopla accepts no responsibility or liability for any decisions you make based on the information provided.
Get your listings ready for our new EV charging point filter, coming July 2025.
Read more
The market is shifting, and opportunities are changing. Whether you're working with sellers, buyers or landlords, having the right insight at your fingertips is key to making confident decisions—and helping your clients do the same.
Read more
The rental market boom is over according to our latest report, here's everything you need to know about today's rental market.
Read more