
Zoopla House Price Index: August 2025
House price growth has steadied at 1.3% year on year, but the market remains firmly in buyers’ hands. Homes priced too high are taking more than twice as long to sell, making accurate pricing the key to moving stock this autumn. Get the latest insights from our August House Price Index below.
Key takeaways
House price growth has stabilised at 1.3% year on year, with average prices now £270,600
Properties that require price reductions take 2.4 times longer to sell than those that don’t
Possible tax changes are speculated to impact homes valued over £500,000, which is a third of homes for sale
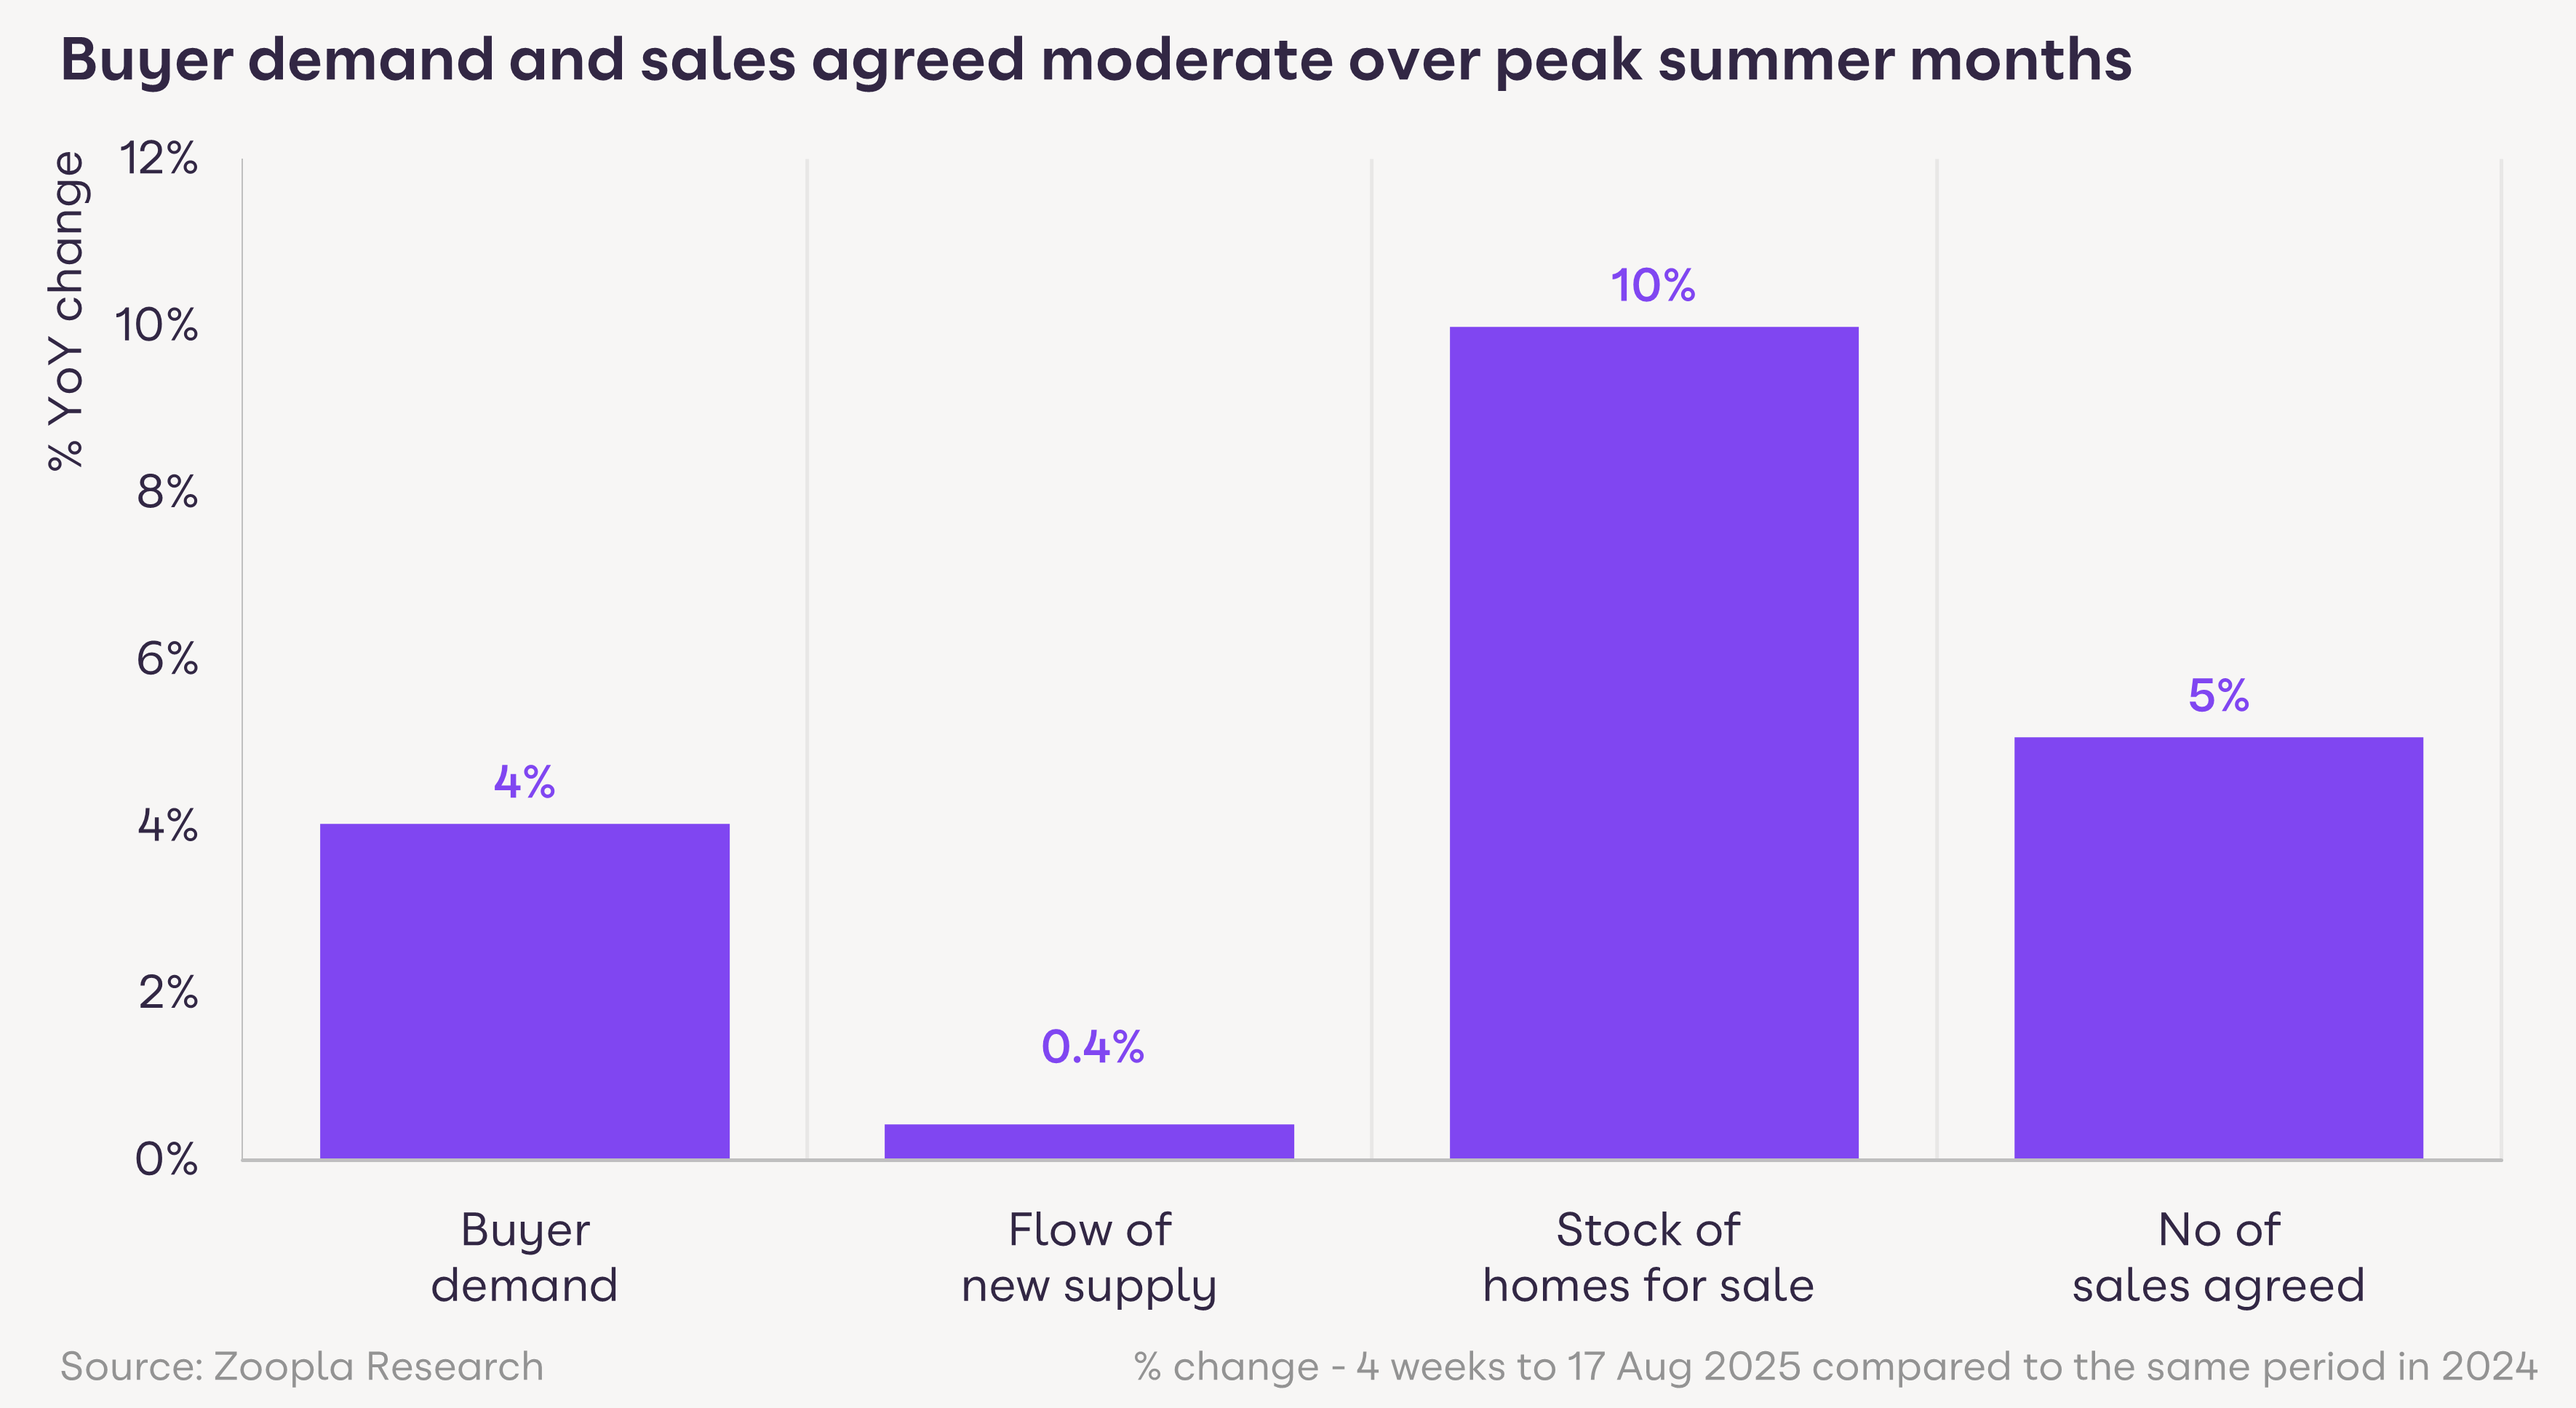
Sales agreed are up 5% on last year, but buyers have more choice with stock levels 10% higher
Average time to sell is 27 days in the North West and North East, compared to 39 days in the South East and South West
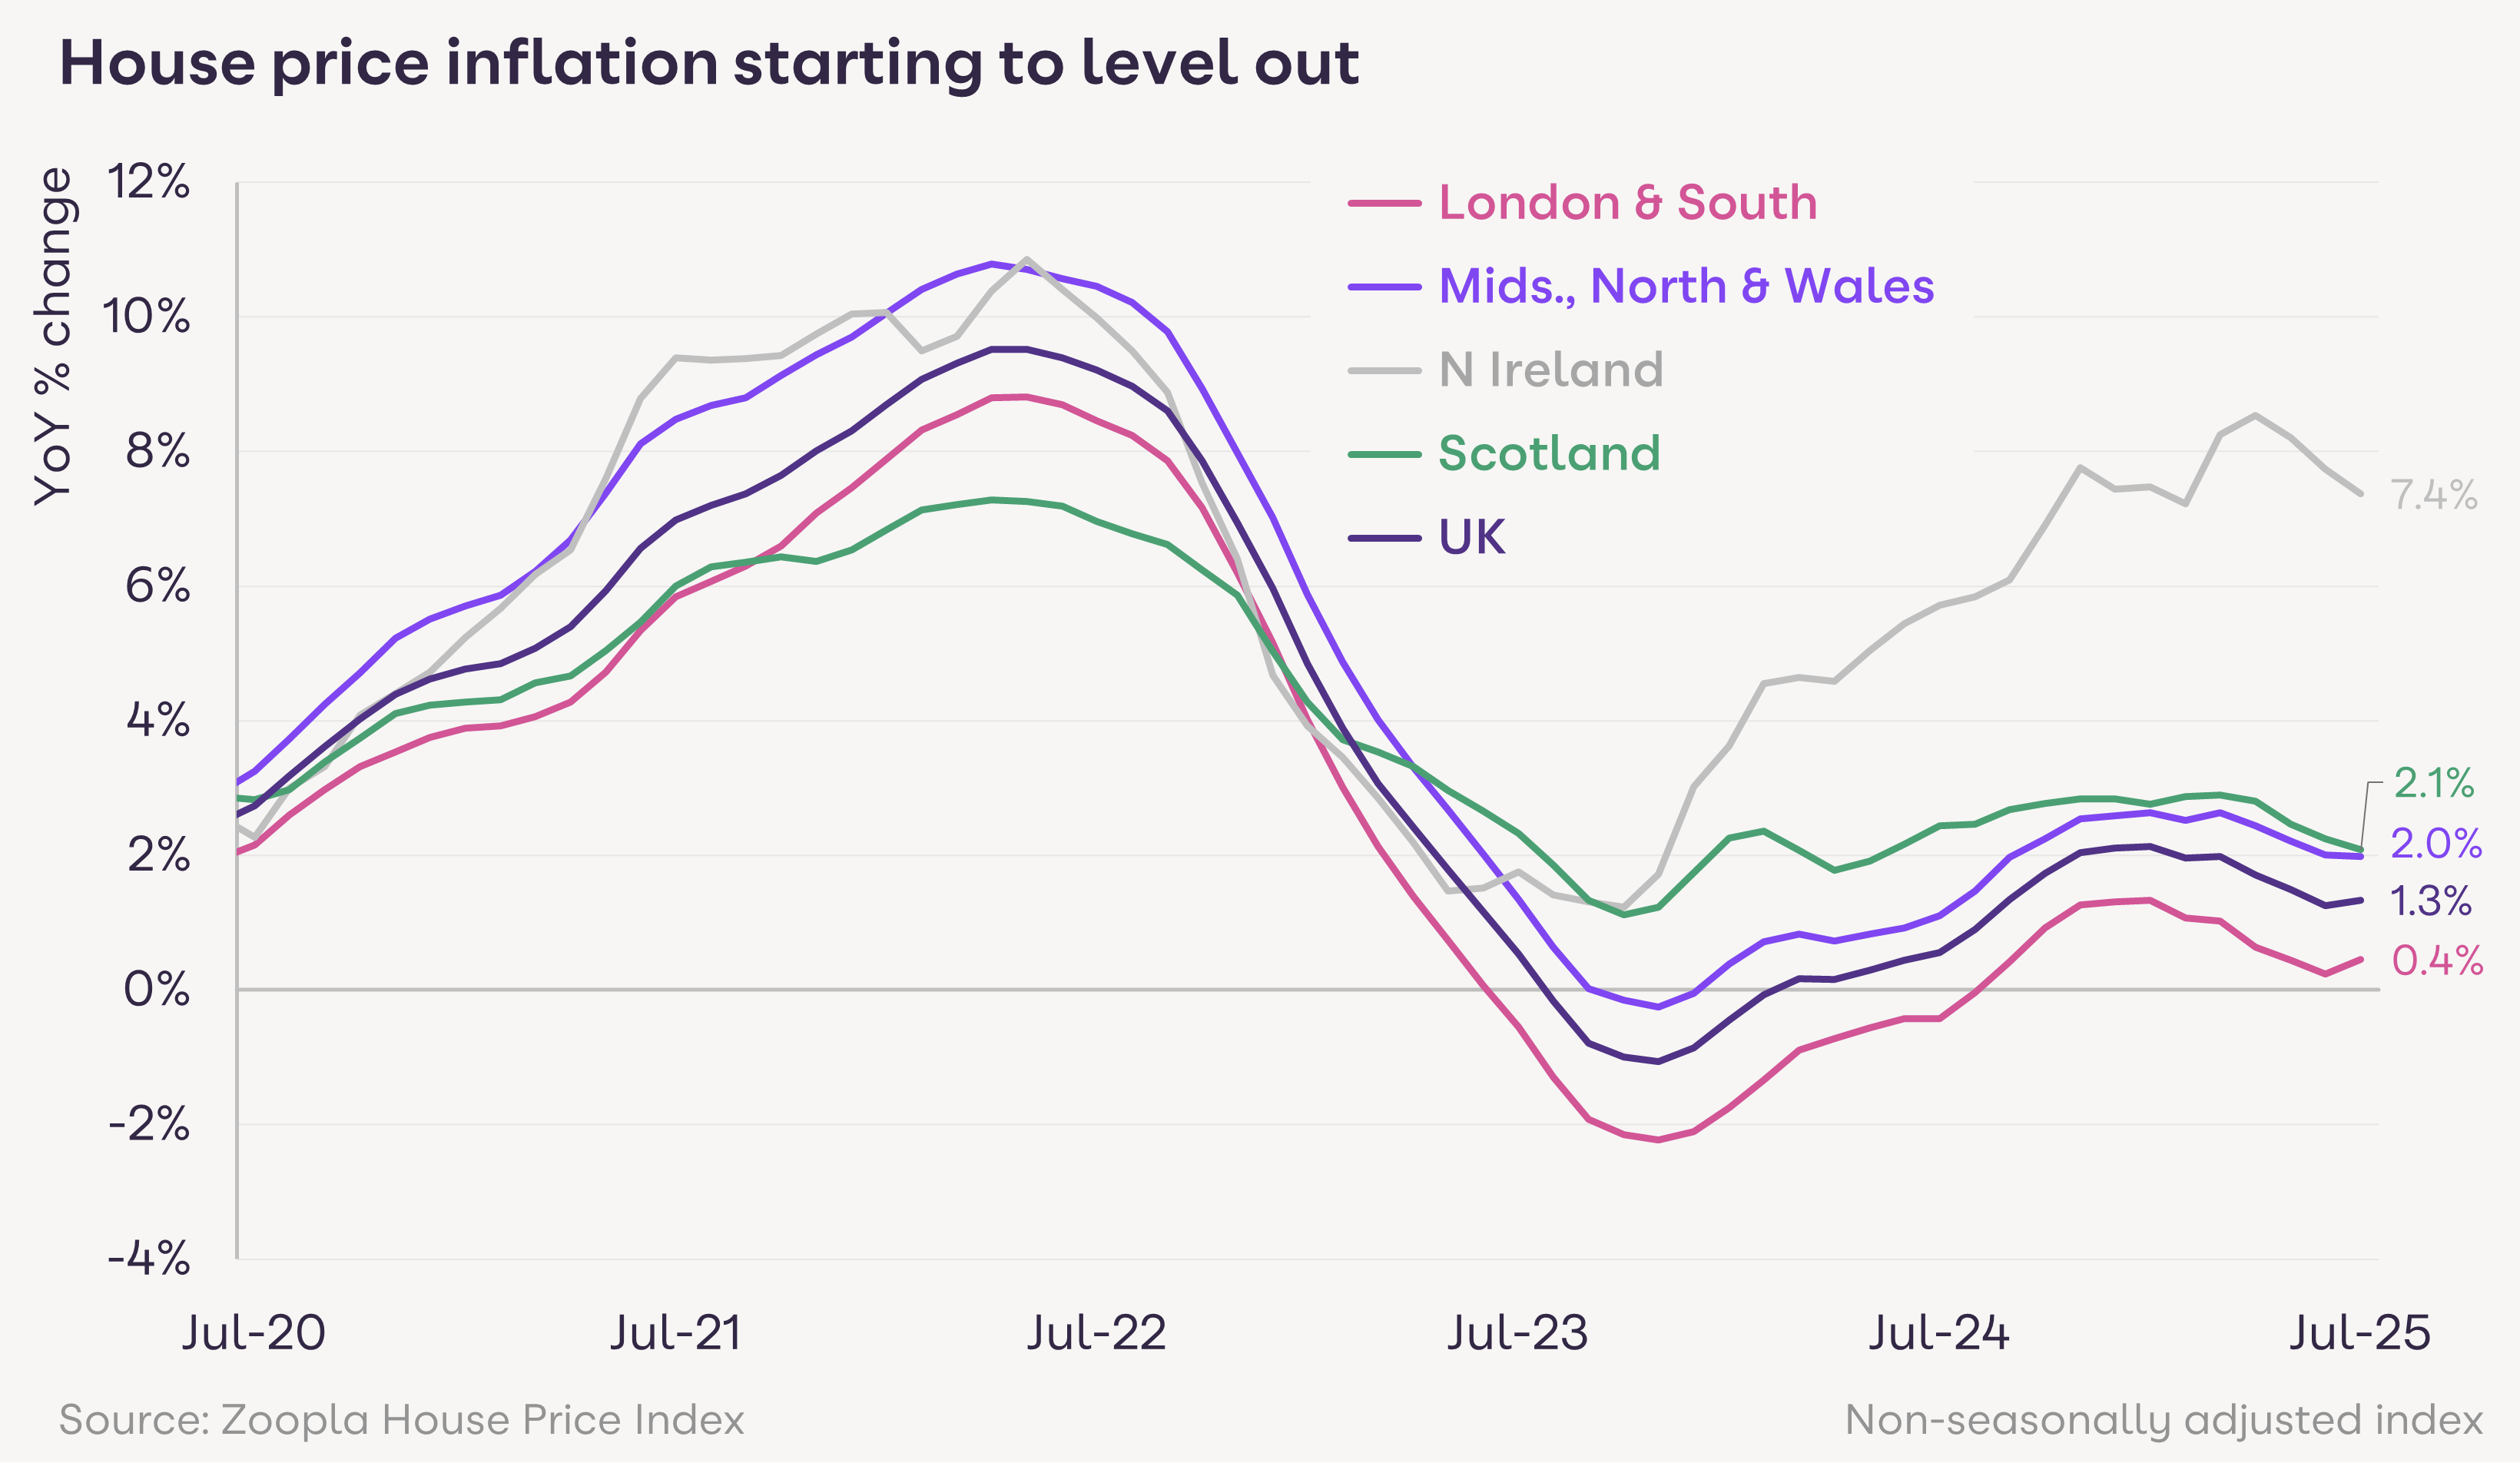
A steady summer for house prices
While house price growth has slowed compared to the start of the year, average UK house prices are now holding steady at 1.3% higher than a year ago, after dipping as low as 0.6% last summer. The average UK home now stands at £270,600, up £3,560 year on year. An increase in supply and continued affordability constraints are shaping the slowdown in growth.
Earnings are rising at 4.7%, outpacing house prices for the third year in a row. This ongoing trend is helping boost affordability and supporting both buyer demand and sales.
Houses priced too high take over twice as long to sell
While buyer demand and sales agreed are up by 4% and 5% respectively, the number of homes for sale is 10% higher than last summer. With more stock in the market, buyers can be selective when choosing a property.
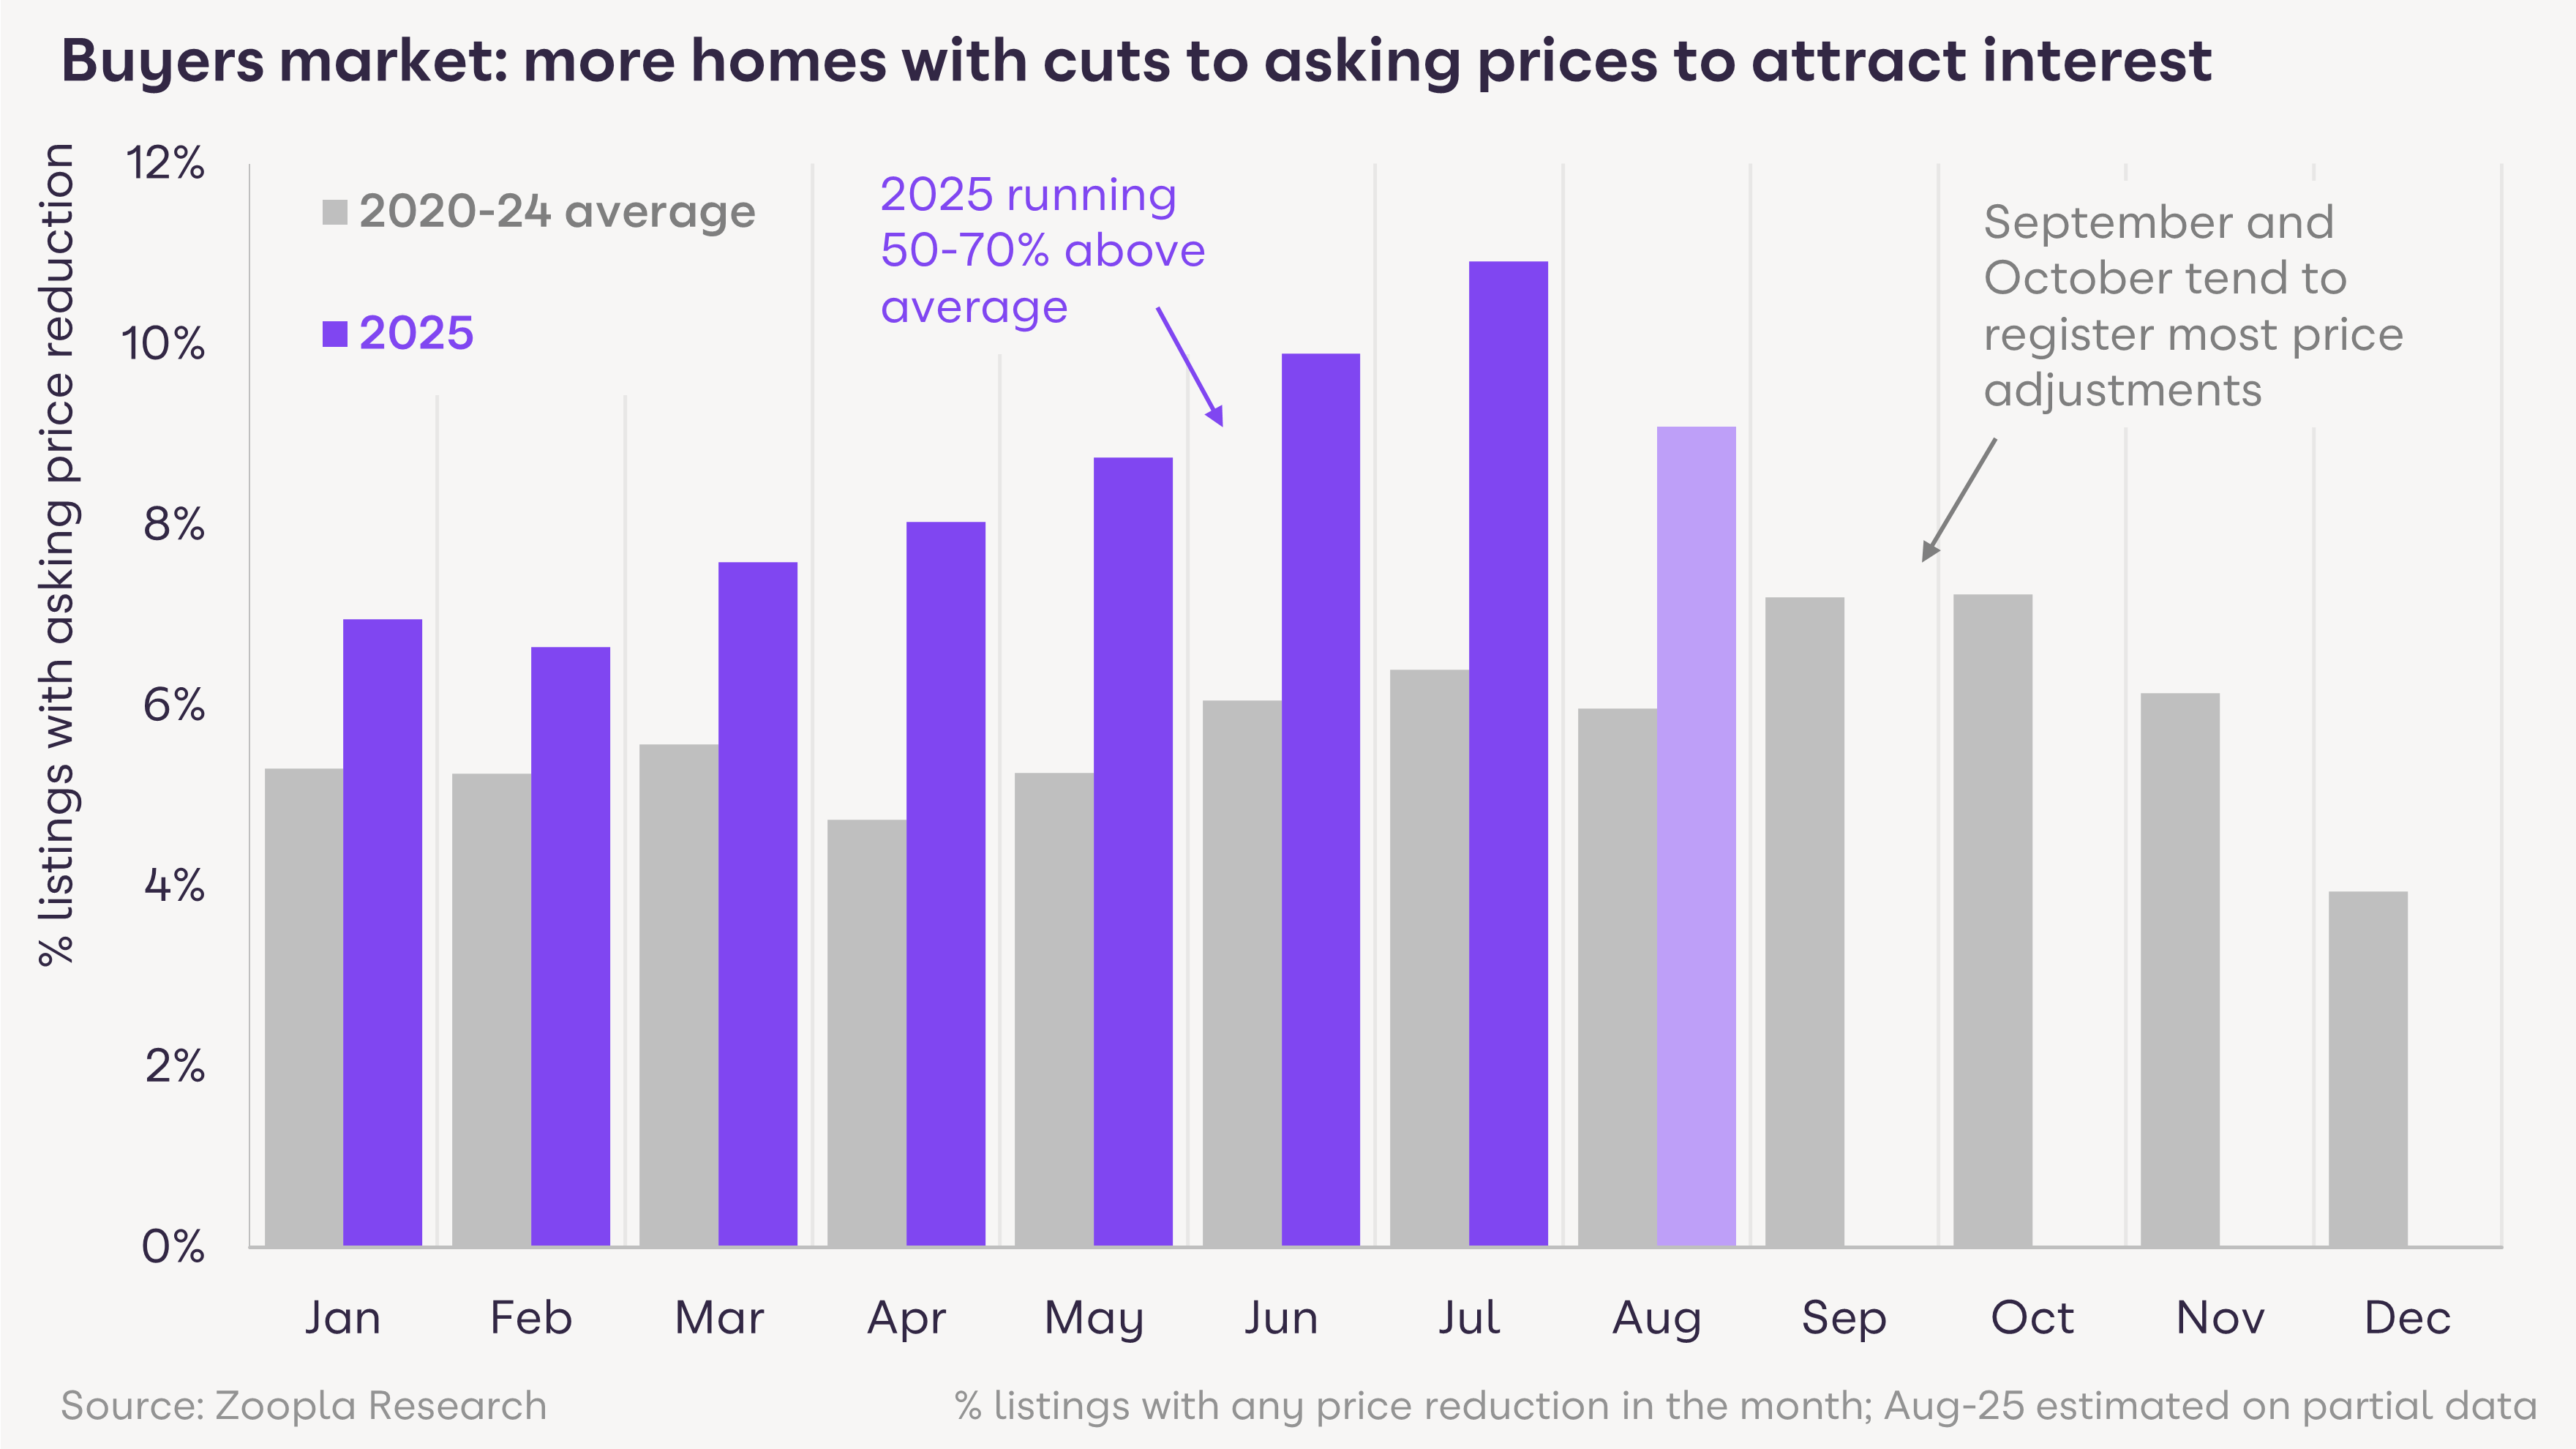
Stand out in competitive markets with the right pricing
With the supply of homes up, there’s been a steady increase in the proportion of homes for sale with price reductions to try and attract buyer interest. In July, one in 10 homes registered a cut to the asking price, well above the five-year average of 6%.
Coastal areas across southern England have the highest competition among sellers, leaving a high proportion of homes unsold. In Truro, Exeter and Bournemouth, more than a quarter of homes for sale have been on the market for over six months, more than a third higher than the average. This increased choice, a result of a larger number of second homes for sale in response to higher council tax, is also impacting prices, which are 1.1% and 1.4% lower than a year ago in these markets.
Other areas with an above-average stock of unsold homes include York, Torquay, and Llandrindod Wells in Wales which face similar challenges. In contrast, cities such as Dundee, Wolverhampton, outer suburbs of London, and Northampton are seeing tighter supply, giving sellers more flexibility and giving you the chance to move stock more quickly.
Making sure your listings are priced competitively is essential, with properties priced too high taking an average of 2.4 times longer to sell. Boosting the visibility of your stock is also key to keeping time-to-sell down, and our tools can help you do exactly that.
Get the tools to stay ahead
Discover our powerful agent tools, designed to boost brand visibility and attract more business.

The North sells faster, while the South falls behind
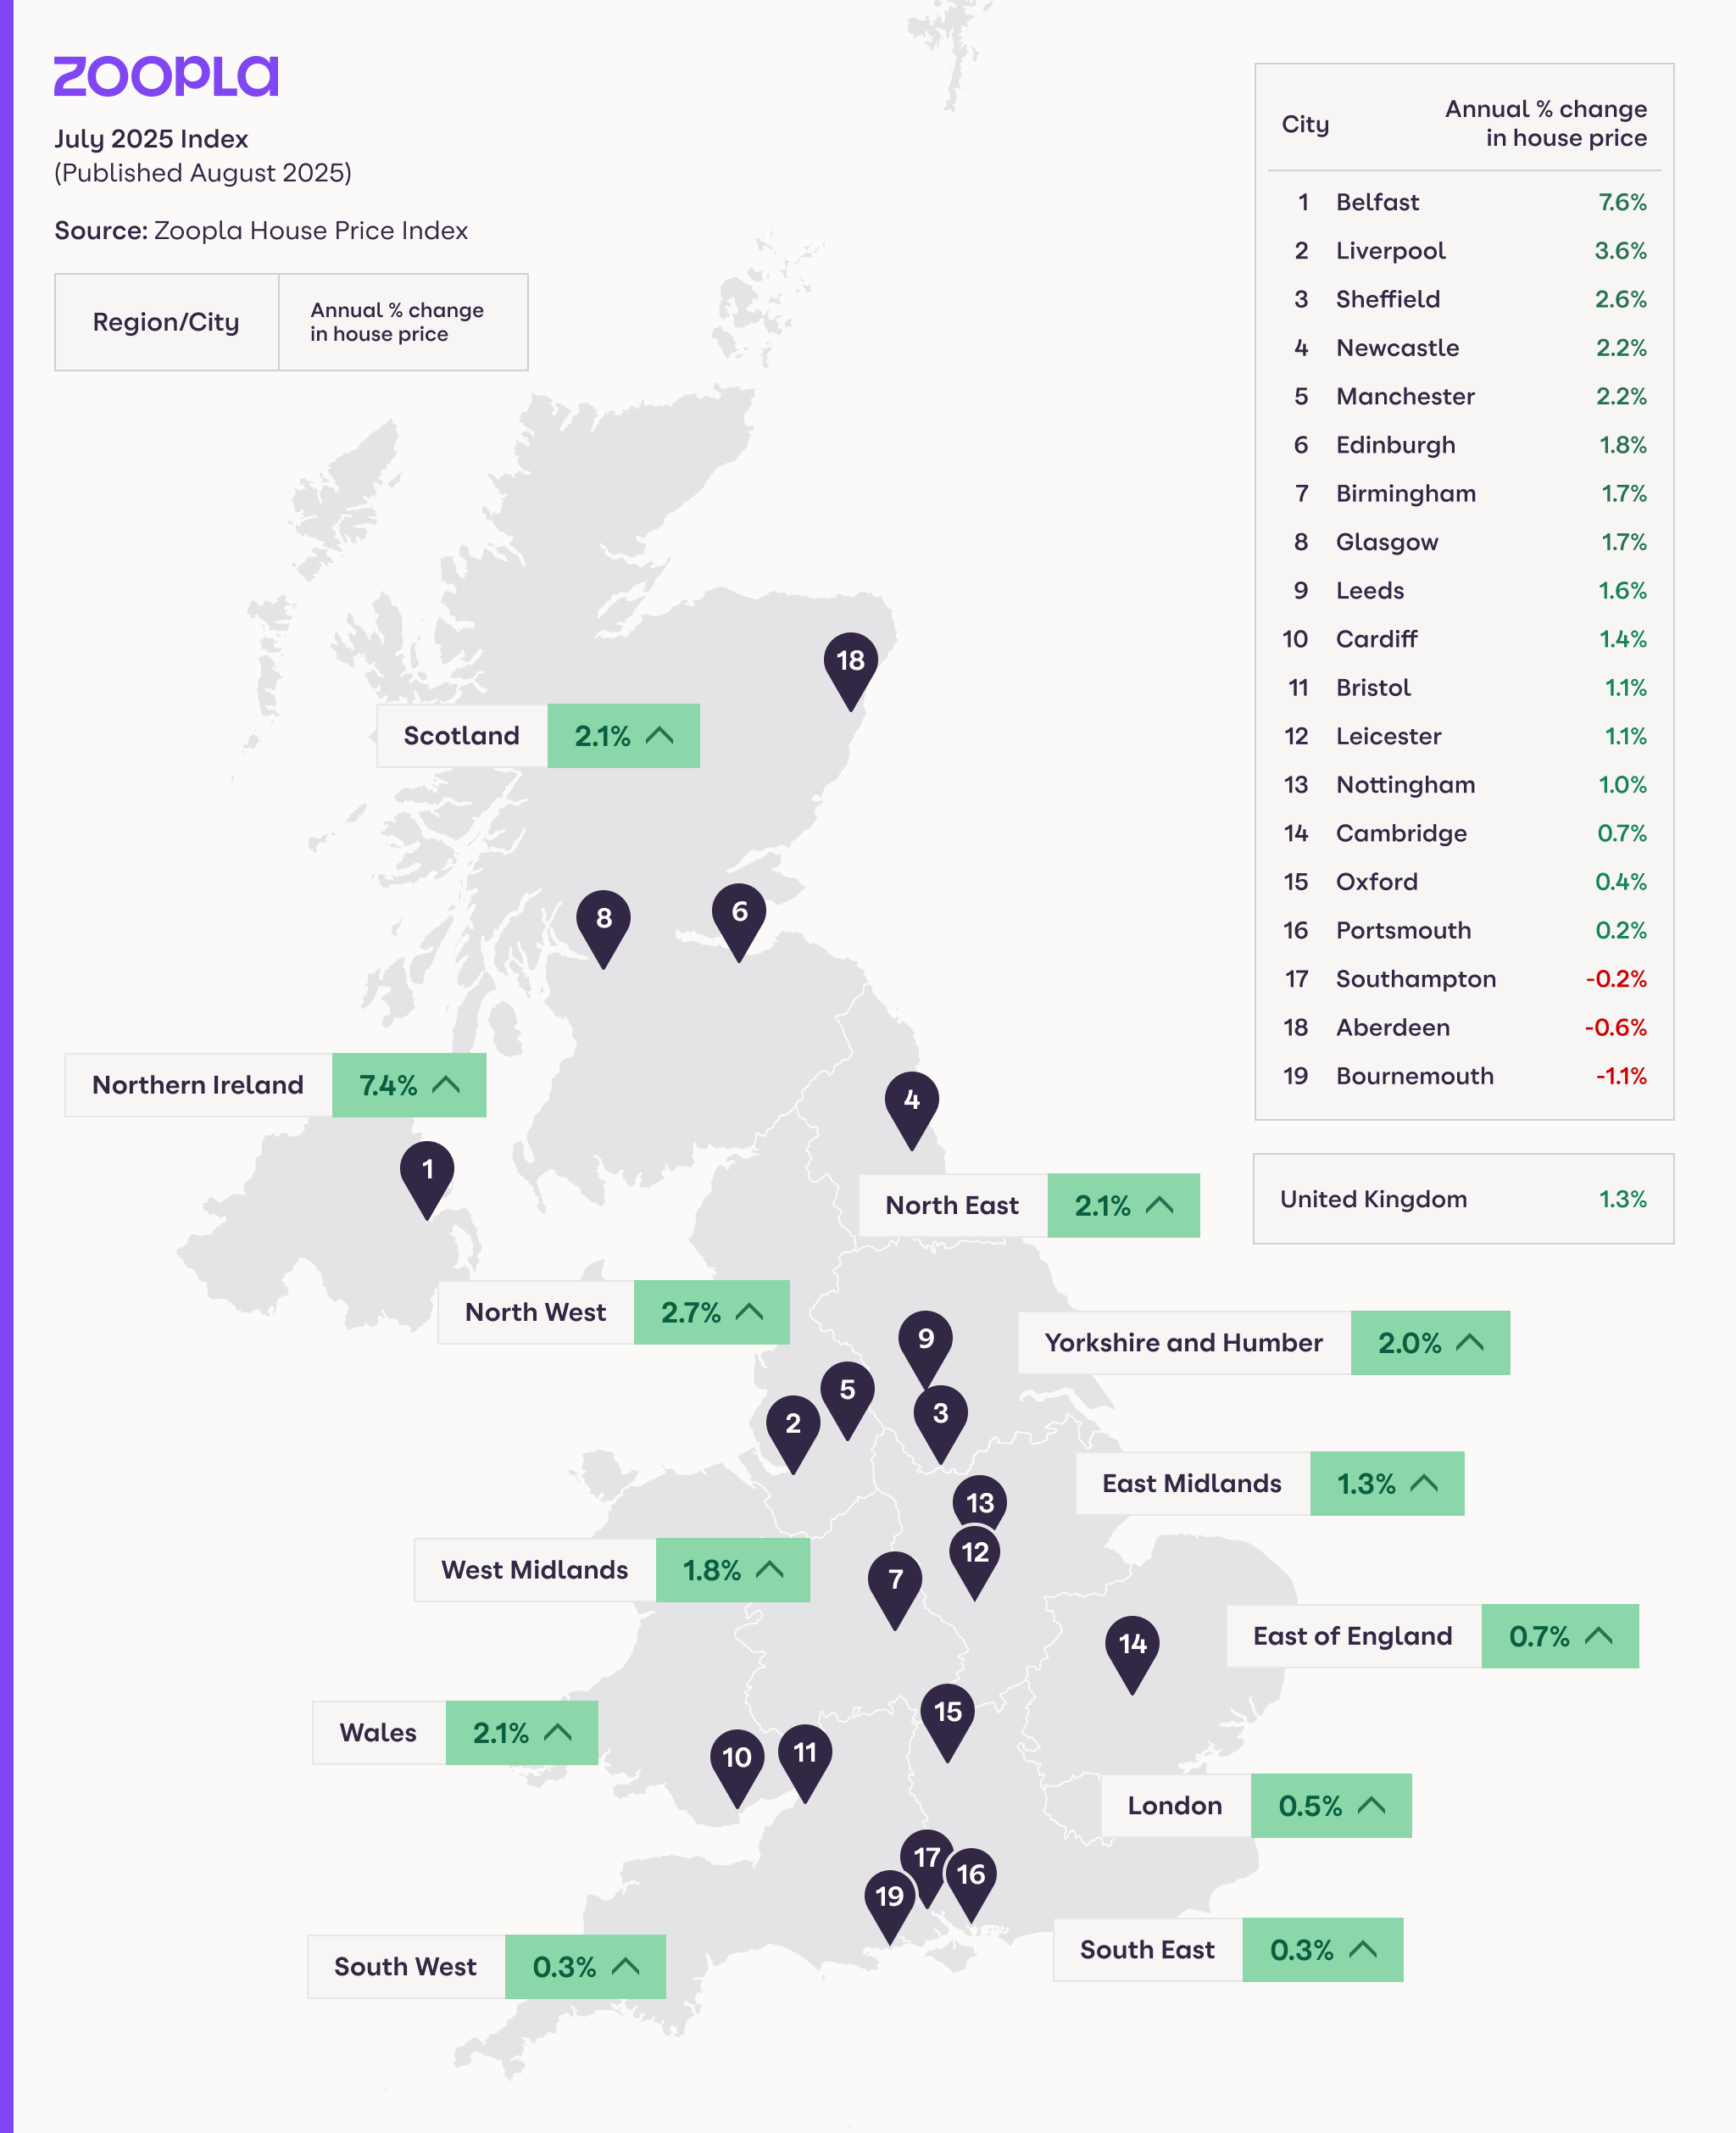
In Northern regions, affordability and lower supply levels are supporting stronger demand, which has resulted in faster sales. Homes in the North West and North East are going under offer in just 27 days on average, 23% faster than the national average of 35 days. This is helping fuel house price inflation in these areas, which is sitting at 2.7% and 2.1% respectively.
In southern regions, where both supply of homes and affordability pressures remain greater, the average time to sell has stretched to 39 days. This is 11% longer than the national average. As a result of this, house price growth is sitting as low as 0.3% in the South East and South West.
Area | Time on market to sold subject to contract (days) | Annual price change (%) |
N West | 27 | 2.7% |
N East | 27 | 2.1% |
Yorks' & H | 32 | 2.0% |
W Mids | 34 | 1.8% |
Wales | 34 | 2.1% |
E Mids | 38 | 1.3% |
Eastern | 38 | 0.7% |
S West | 38 | 0.3% |
London | 39 | 0.5% |
S East | 40 | 0.3% |
England & Wales | 35 | 1.3% |
Track, manage and grow with ZooplaPro
Already listing with Zoopla? Log in to ZooplaPro to track performance, manage leads and get the latest local market trends.

Tax speculation creates uncertainty
Speculation around possible changes to property taxation has created additional uncertainty, particularly in London and the South East where house values are higher. The proposed changes include replacing stamp duty with an annual property tax for homes over £500,000 and introducing capital gains tax for homes over £1.5m, and it may cause some buyers to hold back.
While rising affordability, stable mortgage rates and strong sales numbers indicate continued buyer activity, clear communication and data-led advice are critical to maintaining buyer confidence in these markets.

What’s next for the market?
Demand for homes remains strong, with more buyers actively looking to move. But with stock levels higher than last year, buyers have more choice and more leverage, especially in higher-value markets. Media speculation about possible tax changes could also make some buyers cautious in the short term.
This means that understanding local market conditions is essential. Setting the right asking price and being realistic about how quickly a property can sell will help you manage seller expectations and avoid listings lingering on the market.
Looking forward, UK house price growth is expected to stay between 1.5% and 2% for the rest of 2025. Prices are firming in parts of Southern England, while growth is easing across northern regions. Sales volumes are on track to be around 1.15 million this year, up 5% compared to 2024, which means there are still plenty of opportunities to move stock and secure instructions.
About our House Price Index
The Zoopla House Price Index (HPI) tracks the change in achieved sales price of homes, it’s not an index tracking asking prices. The index uses sold prices, mortgage valuations and data for recently agreed sales with more input data than any other index. The methodology is designed to accurately track the change in pricing for UK housing. It’s a revisionary index and non-seasonally adjusted.
Additional notes on this month’s data:
Zoopla’s House Price Index data goes up until the end of July 2025. Data on sales agreed and growth in homes for sale cover the 4 weeks to 17 August 2025 compared to the same period in 2024.
Zoopla’s house price index measures the change in house prices where sales are agreed - it is not an asking price index. Zoopla analyses changes in asking prices separately to inform the likely direction of actual sales prices along with other key market indicators.
We try to make sure that the information here is accurate at the time of publishing. But the property market moves fast and some information may now be out of date. Zoopla accepts no responsibility or liability for any decisions you make based on the information provided.